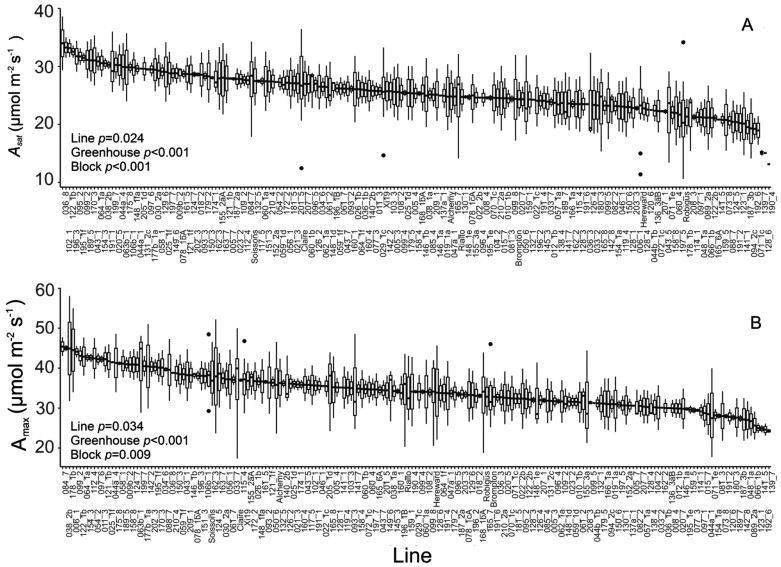
Fig. 2.
Steady-state photosynthetic traits estimated via A/Ci curves. (A) The variation between lines for photosynthetic CO2 uptake at saturating light and ambient CO2 concentration (Asat). (B) The variation between lines for photosynthetic CO2 uptake at saturating light and elevated CO2 concentration (Amax). For graphs, horizontal lines within boxes indicate the median and boxes indicate the upper (75%) and lower (25%) quartiles. Whiskers indicate the ranges of the minimum and maximum values. Circles indicate outliers. Data were analysed with ANCOVA (n=2–10), and P-values for the main effects are shown in the graph.

