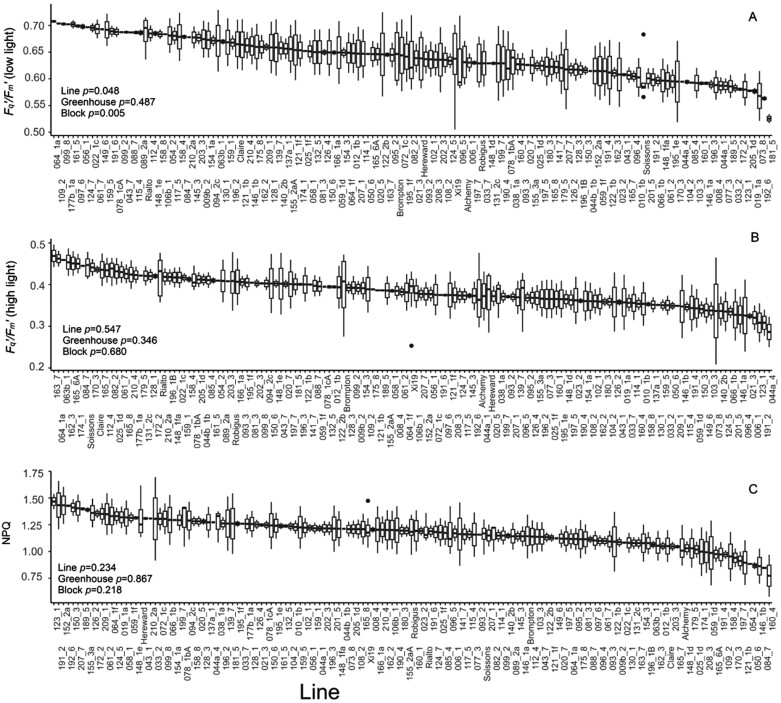
Fig. 5.
PSII operating efficiency at 100 µmol m–2 s–1 PPFD (Fq'/Fm' low light), PSII operating efficiency after 30 min at 1000 µmol m–2 s–1 PPFD (Fq'/Fm' high light), and non-photochemical quenching after 30 min at 1000 µmol m–2 s–1 PPFD (NPQ). Data were estimated via chlorophyll fluorescence imaging. For graphs, horizontal lines within boxes indicate the median and boxes indicate the upper (75%) and lower (25%) quartiles. Whiskers indicate the ranges of the minimum and maximum values. Data were analysed with ANCOVA (n=2–10), and P-values are shown in the graph.

