
Figure 3. Association of Time to Death and Other Key Variables With Death-Censored Graft Survival.
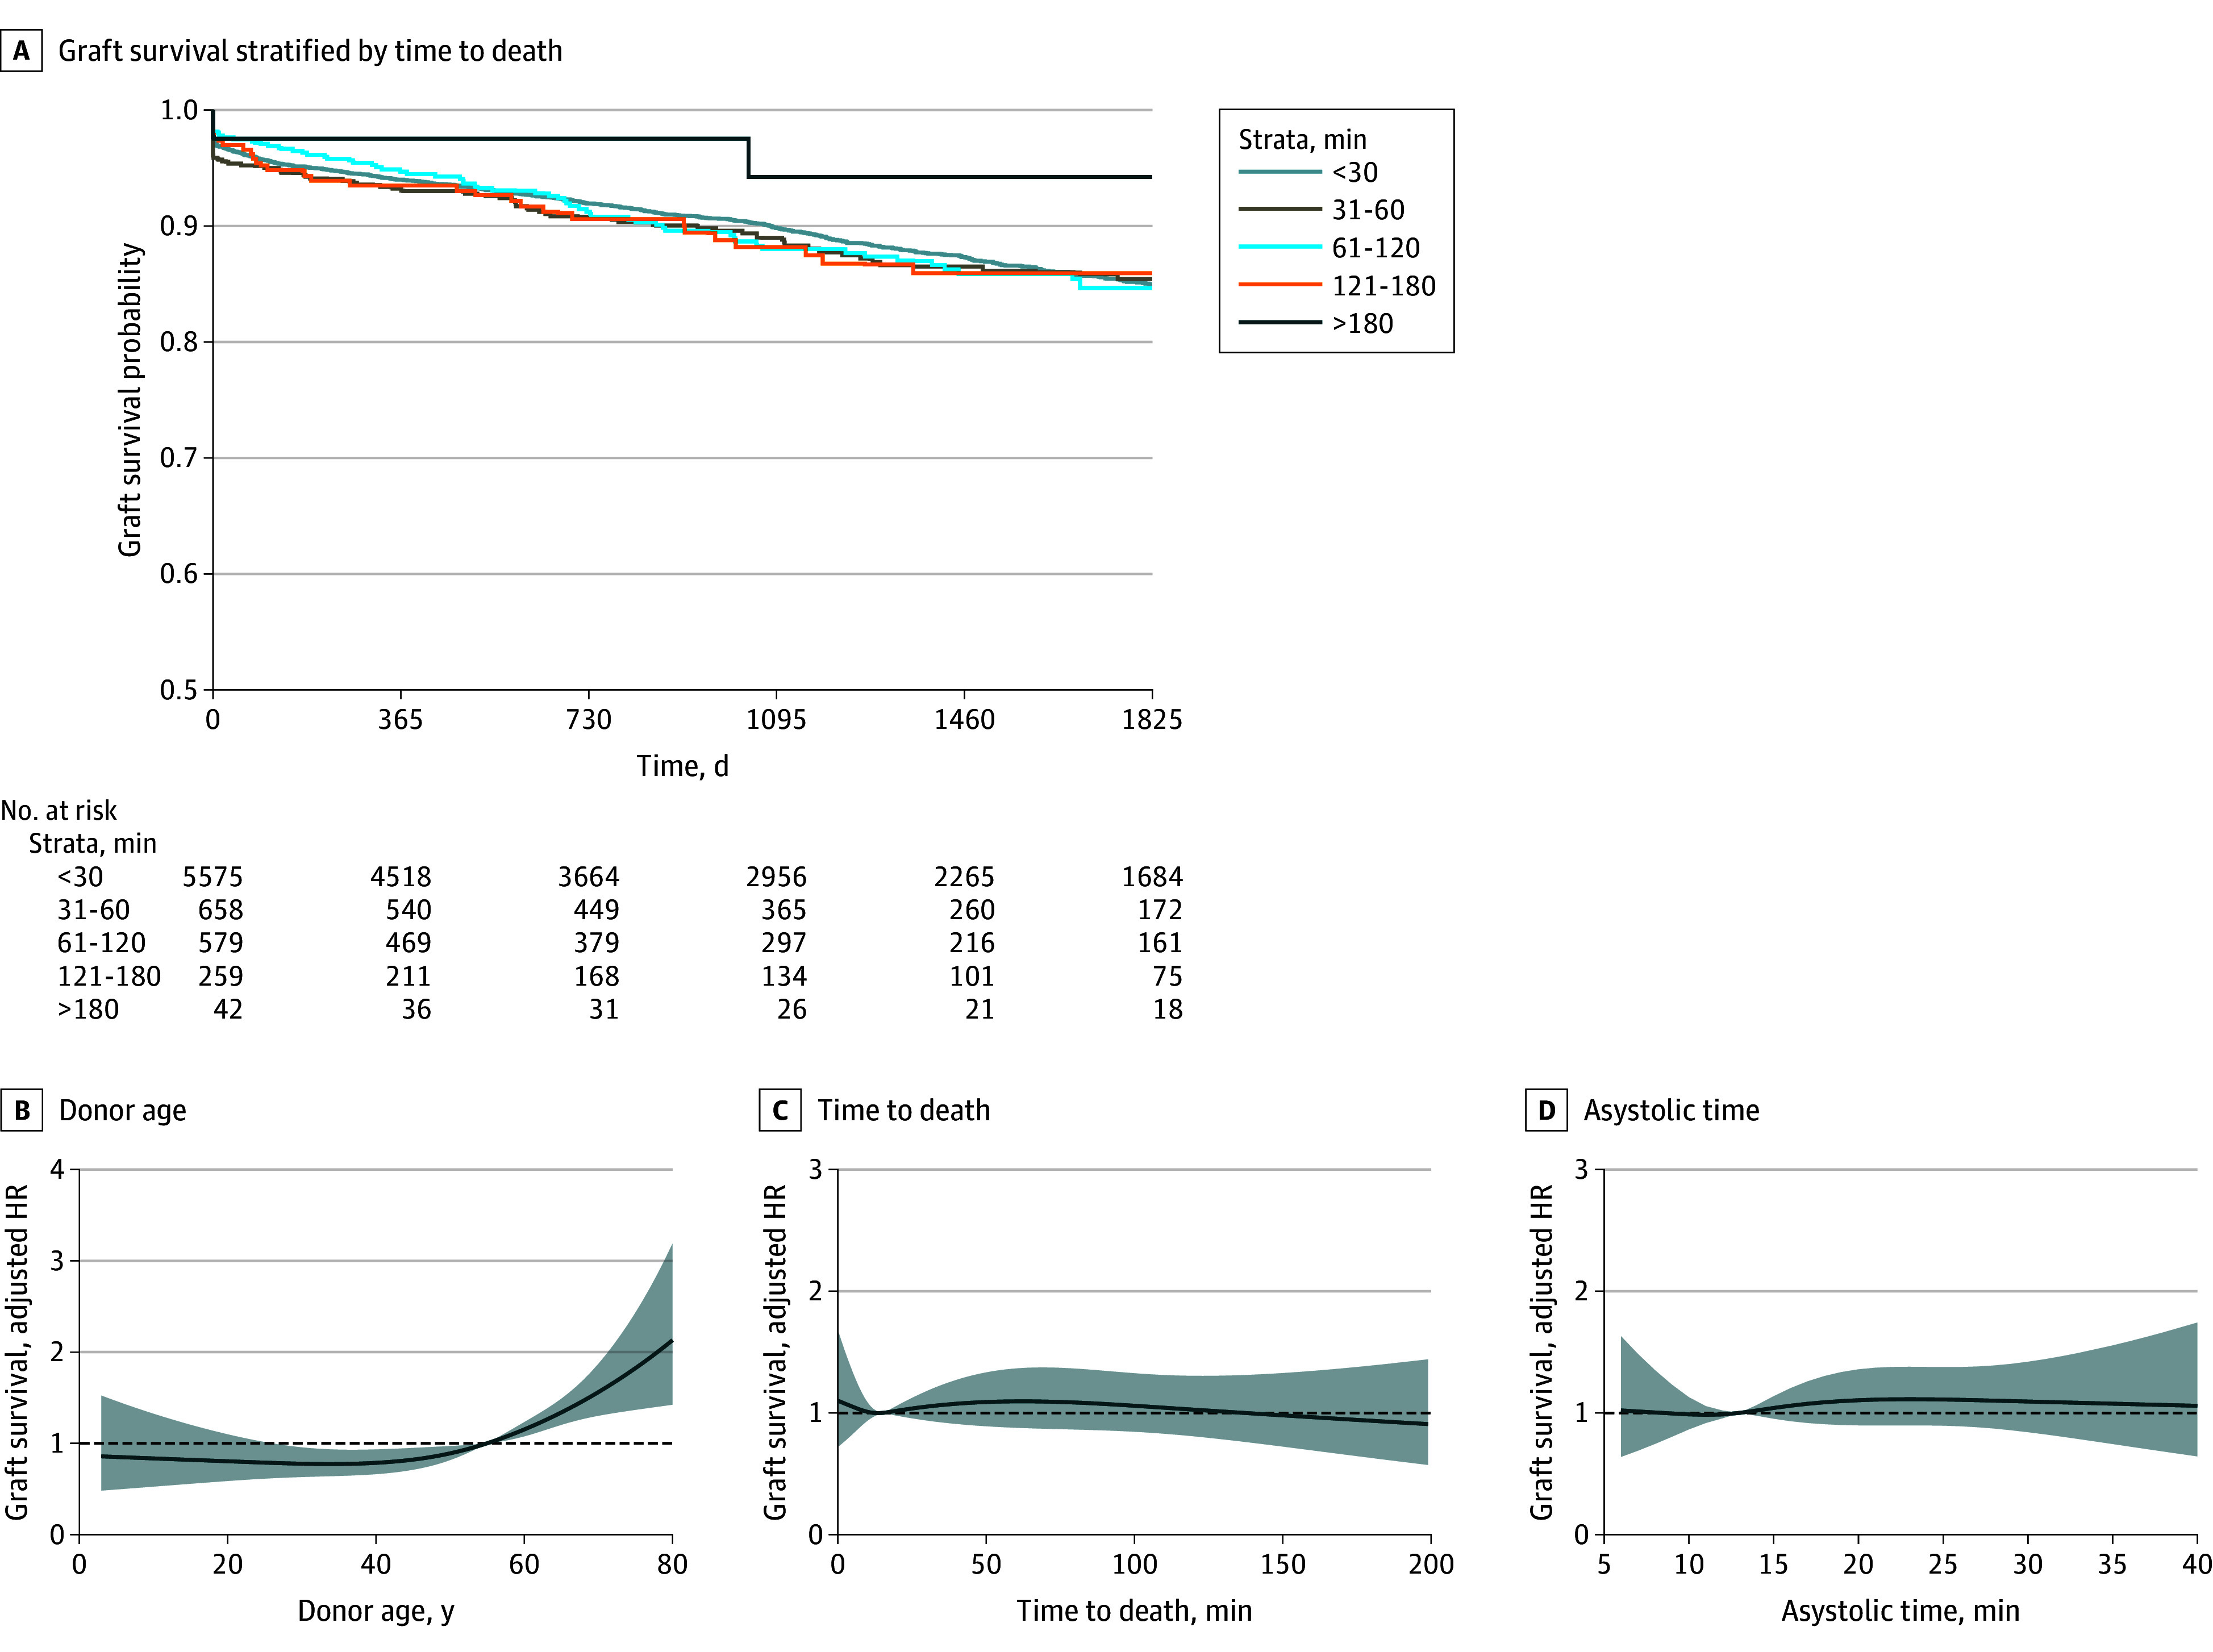
A, Kaplan-Meier plot as a visual representation of time-to-death categories. B, Donor age. C, Time to death (withdrawal of life-sustaining treatment to mechanical asystole). D, Asystolic time. Restricted cubic splines had 4 knots and were adjusted for all factors in eTable 8 in Supplement 1. Results were pooled from 20 imputed datasets. Includes patients with complete graft survival follow-up data (n = 7113). HR indicates hazard ratio.