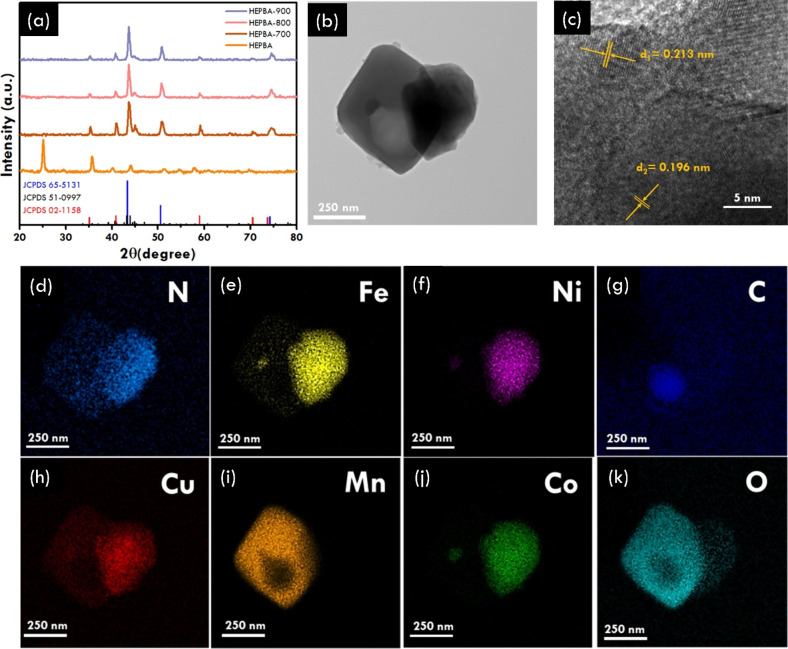
Figure 2.
Characterization of HEPBA and its derivation. (a) XRD pattern of annealed HEPBA at various temperatures; (b) High resolution TEM image of HEPBA-800 and (c) the corresponding TEM lattice fringe; EDS elemental mapping images of (d) N, (e) Fe, (f) Ni, (g) C, (h) Cu, (i) Mn, (j) Co, and (k) O for HEPBA-800.

