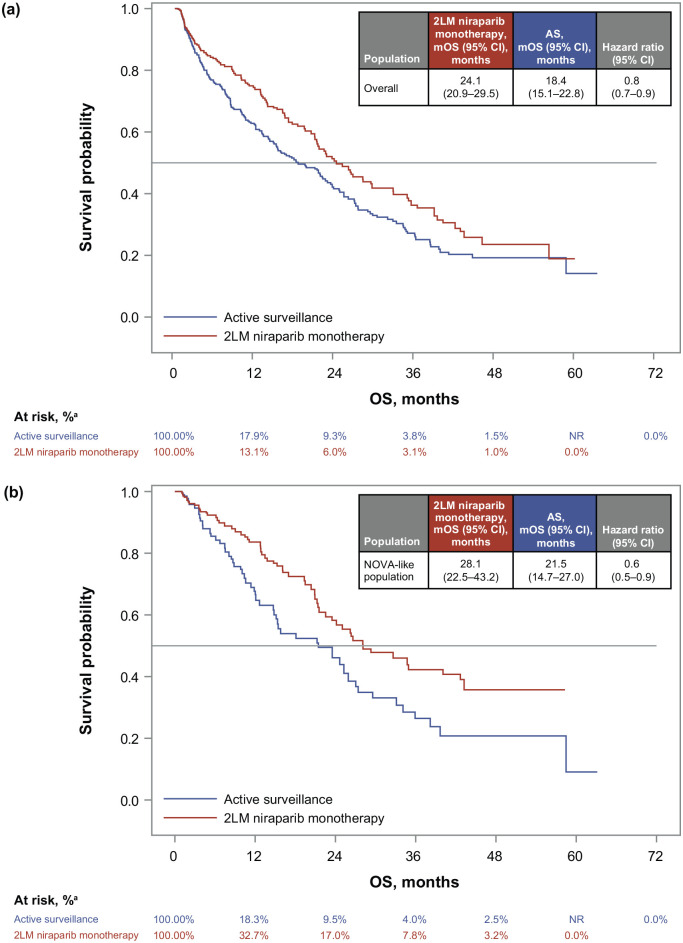
Figure 2.
Adjusted Kaplan–Meier curves and adjusted hazard ratios for the (a) overall population and (b) the NOVA study-like subpopulation.
The survival curves were estimated using a stabilized IPC-weighted nonparametric Kaplan–Meier estimator, and hazard ratios were estimated using stabilized IPC-weighted Cox proportional hazards regression models.
aPercentage at risk is reported in percentages because of the weighting approach that can result in non-whole numbers.
2LM, second-line maintenance; AS, active surveillance; IPC, inverse probability of censoring; mOS, median overall survival; NR, not reported; OC, ovarian cancer; OS, overall survival; wt, wild type.

