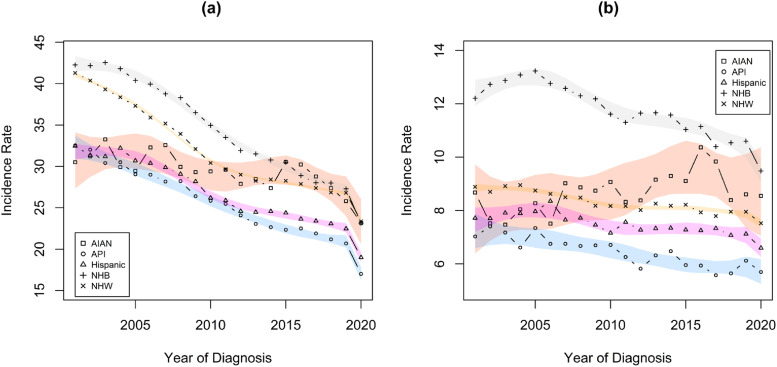
Figure 2.
Trends in Localized or Regional and Distant summary stage CRC incidence rates, separately for each racial/ethnic group. Rates are per 100 000 and age-adjusted to the 2000 US Std Population (19 age groups - Census P25-1130) standard. Estimates were obtained from the results of the meta-regression linear models analyses. (a) Localized or regional (b) Distant.

