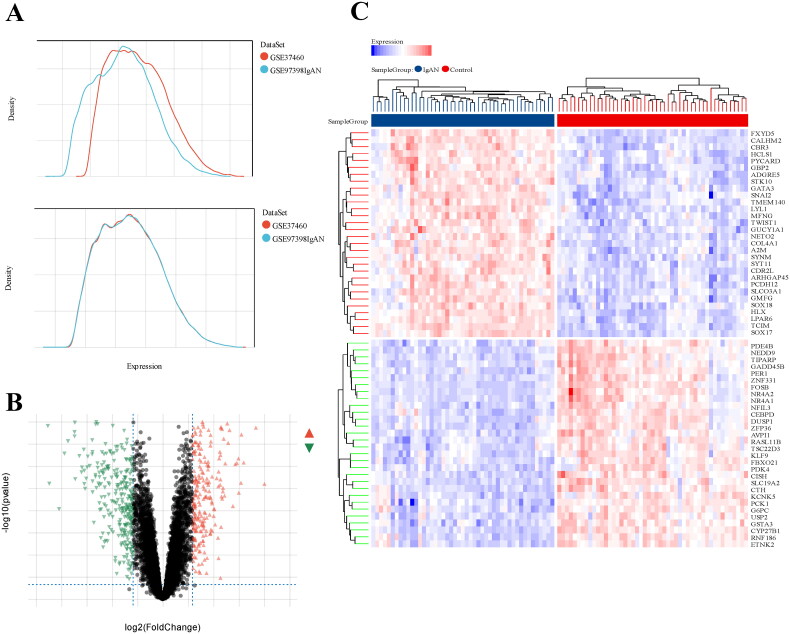
Figure 1.
Differentially expressed genes between IgAN and healthy control samples. (A) a density map was utilized to eliminate batch effect. (B) a volcano plot illustrates the DEGs between the two groups, with red genes indicating high expression in IgAN, green genes showing low expression, and gray genes reflecting no significant changes. (C) a heat map displays the top 30 transcriptome expressions of DEGs between the two groups. Datasets from GSE93798 and GSE37460.

