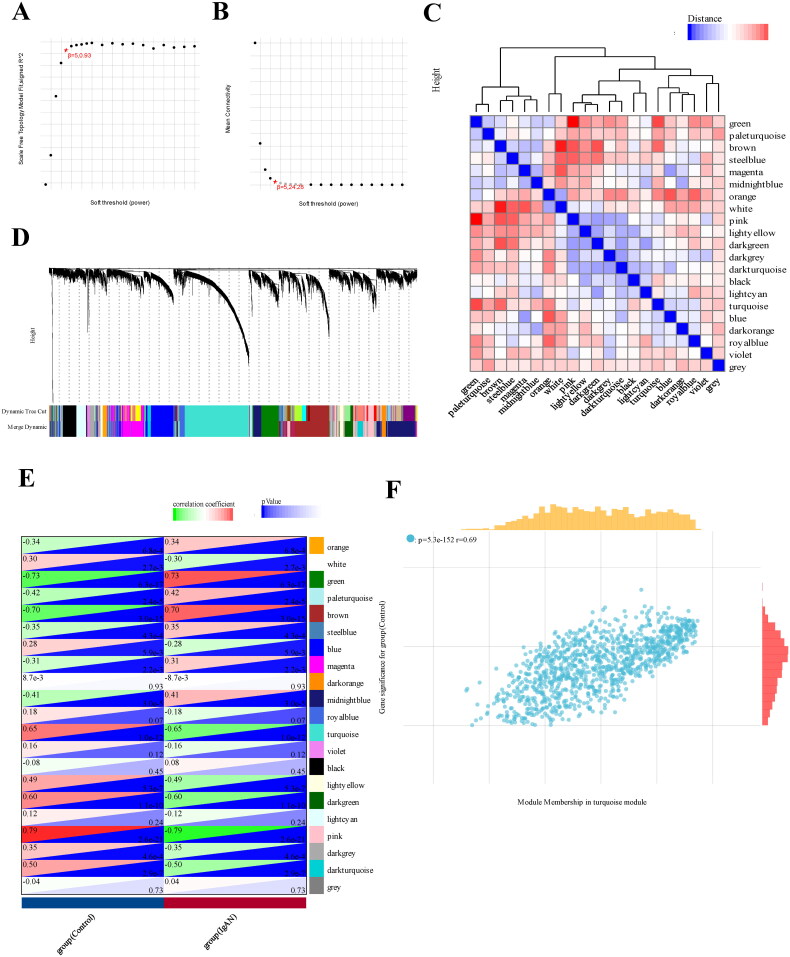
Figure 2.
WGCNA analysis of differentially expressed genes. (A) a cluster dendrogram representing 96 kidney tissue samples, including 47 IgAN samples and 49 healthy control samples, along with the corresponding mean connectivity values at various soft threshold powers. (B) a cluster dendrogram of the genes. (C) Correlations between module eigengenes and clinical traits of IgAN. (D) a cluster dendrogram of differentially expressed genes to identify the clinically significant modules associated with IgAN. (E) Relationships between different modules and clinical traits, where red represents positive correlation and blue indicates negative correlation. (F) Correlation of module membership and gene significance within the turquoise module. Datasets from GSE93798 and GSE37460.

