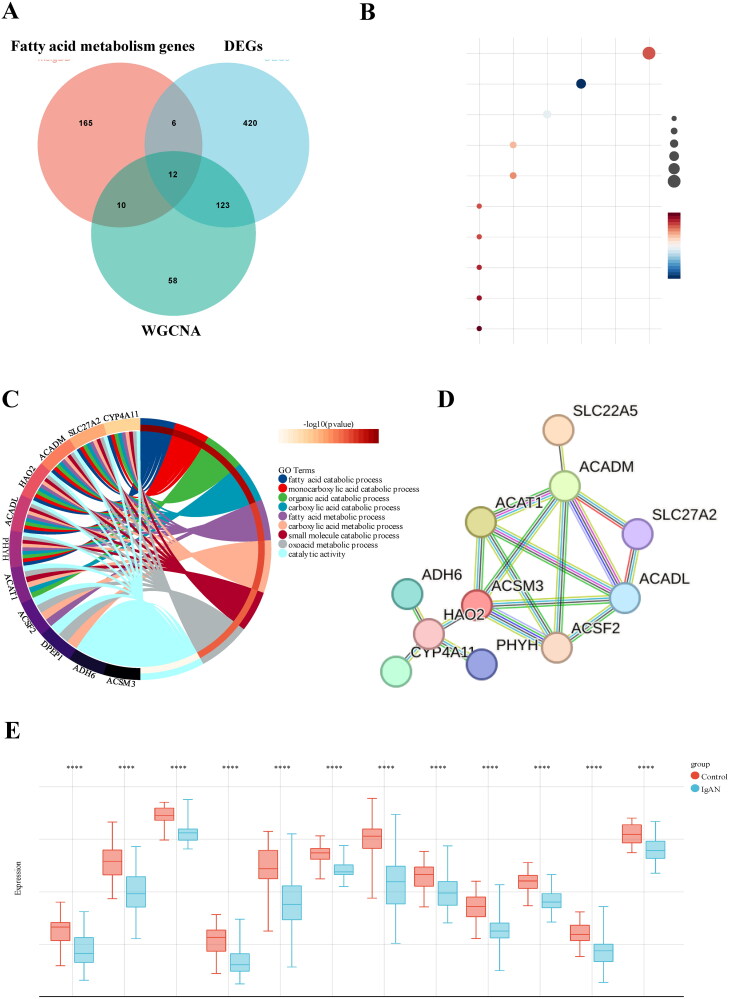
Figure 3.
GO and KEGG pathway enrichment analysis of DEGs. (A) 12 hub genes were identified by intersecting the DEGs, turquoise module genes from WGCNA, and fatty acid metabolism-related genes. (B) KEGG pathway enrichment analysis of the common genes. (C) GO analysis of the shared genes. (D) a PPI network of the 12 hub genes constructed using STRING. (E) Expression levels of the 12 hub genes in kidney tissue samples from IgAN and control groups. Datasets from GSE93798 and GSE37460.

