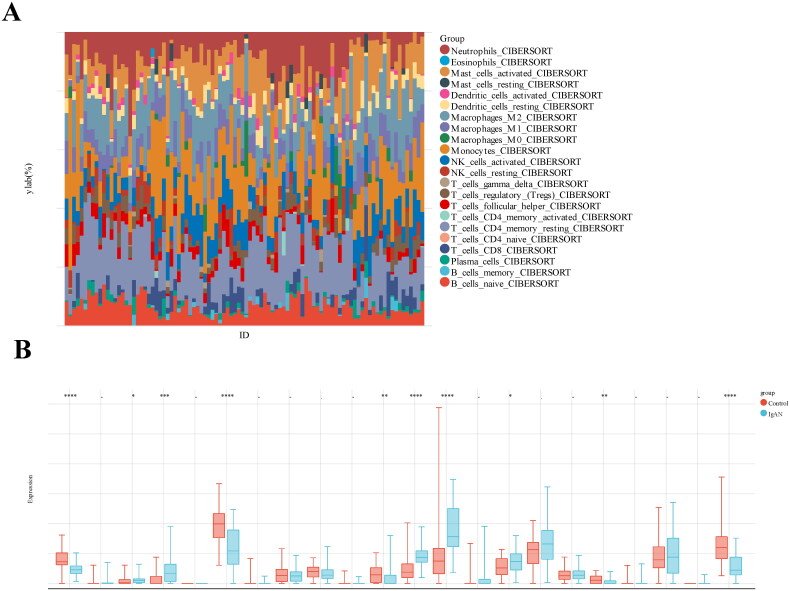
Figure 7.
Estimation of peripheral immune cell infiltration using the prognostic signature. (A) The relative percentages of 22 immune cells in each sample. (B) Levels of peripheral immune infiltration in IgAN versus healthy control groups, analyzed through CIBERSORT algorithms. Boxplot illustrate the differences in peripheral immune infiltration scores between the two groups. Datasets from GSE93798 and GSE37460.

