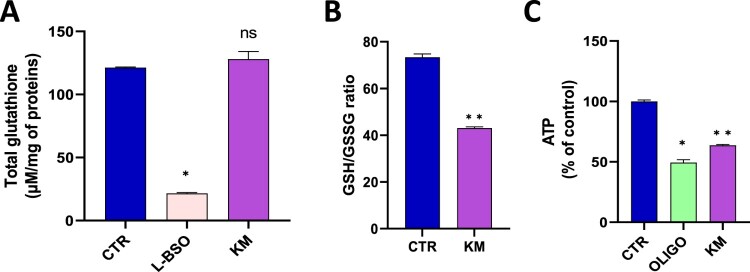
Figure 2.
(A) level of total glutathione (reduced GSH and oxidized GSSG forms), N = 3, Anova One-way, Dunnett’s multiple comparison test. CTR = control, OLIGO = oligomycin, BSO = buthionine-sulfoximine, KM = kresoxim-methyl 7 µM (B) ratio between the levels of reduced GSH and oxidized GSSG forms, N = 6, T-test; (C) Level of ATP, N = 3, T-test. Bars represent mean ± SEM. (*): p < 0.05, (**): p < 0.01, ns: not significant. p values are compared to control.

