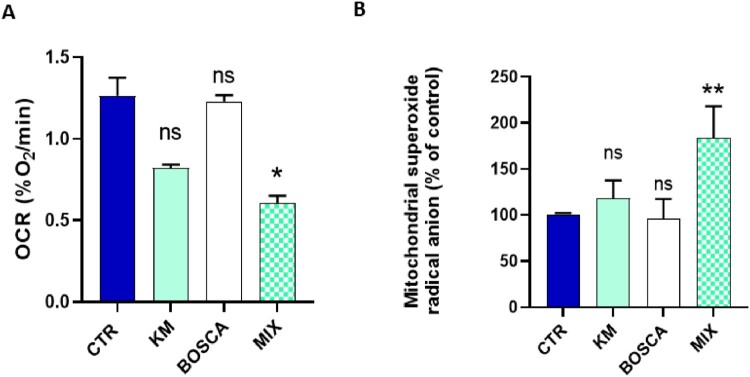
Figure 4.
Impact of 24 h exposure to a kresoxim-methyl 5 μM/boscalid 0.5 µM mixture on HepG2cells. CTR = control, OLIGO = oligomycin, BSO = buthionine-sulfoximine, KM = kresoxim-methyl 5 µM, BOSCA = boscalid 0.5 µM, MIX = kresoxim-methyl 5 μM/boscalid 0.5 µM mixture (A) oxygen consumption rate, N = 3, Anova One-way, Dunnett’s multiple comparison test; (B) level of mitochondrial superoxide radical anion, N = 3, Anova One-way, Dunnett’s multiple comparison test. Bars represent mean ± SEM. (*): p < 0.05, (**): p < 0.01, ns: not significant. p values are compared to control.

