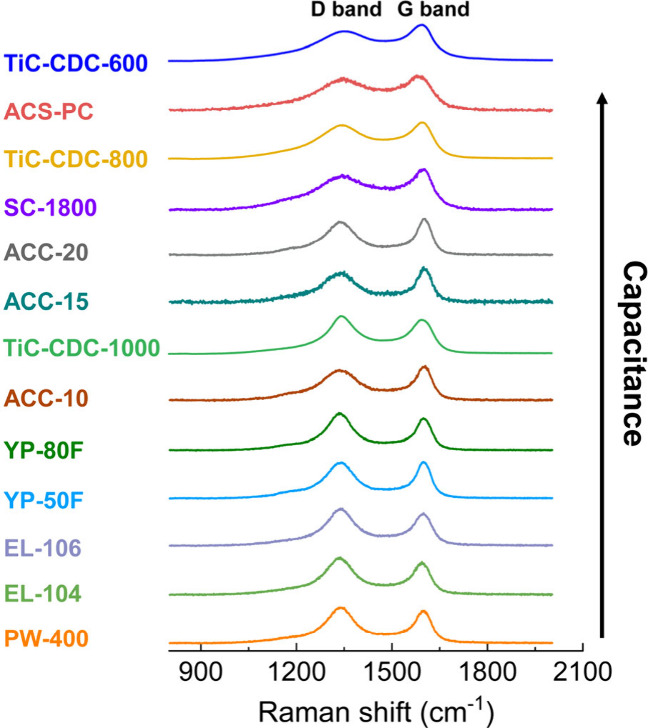
Figure 1.

Raman spectra (532 nm) of ten commercial nanoporous carbons, with literature spectra also shown for three TiC-CDCs (532 nm)5,19 which are reproduced with permission from ref (19), copyright [2015] American Chemical Society. Raman spectra are plotted in order of their increasing capacitance. Raman spectra were also acquired at multiple spots and using various spot sizes (Figures S3–S5) in consideration of the potential inhomogeneity of the carbons. Gravimetric capacitances of commercial nanoporous carbons were measured in two-electrode symmetric coin cells at 0.05 A/g in 1 M NEt4BF4 (acetonitrile, ACN). Capacitances of TiC-CDCs were extracted from previous literature,5 and were measured in two-electrode cell at 5 mA/cm2 in 1.5 M NEt4BF4 (ACN) (Table S1), with that data reproduced with permission from ref (5), copyright [2006] The American Association for the Advancement of Science.
