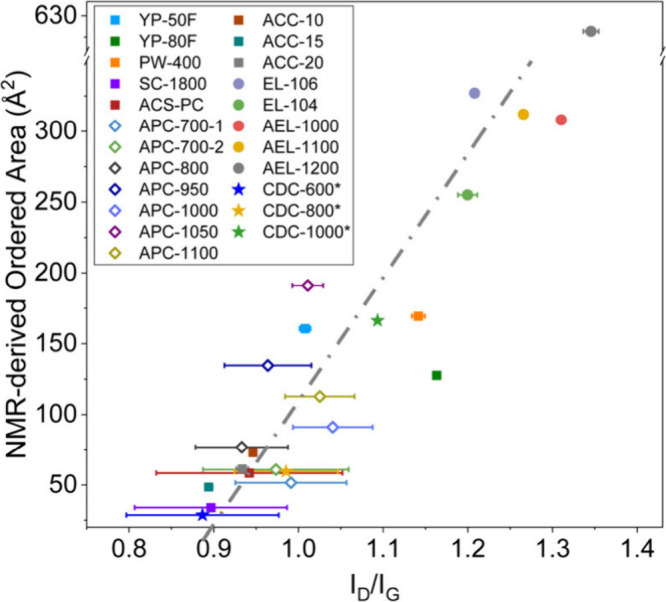
Figure 3.

Correlation between the ordered area from NMR simulations and ID/IG intensity ratio of the studied carbons. The error bars of the Raman parameters demonstrate the standard deviation of fits from three independent researchers (see experimental section) and reflect the difficulty associated with deconvoluting overlapping peaks. The error bars are larger for the more disordered carbons due to increased peak overlap.
