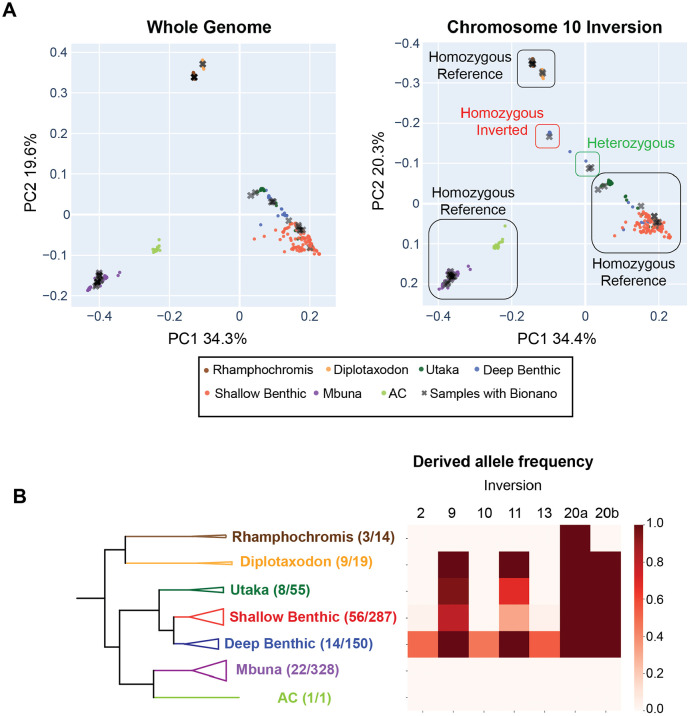
Figure 3. Distribution of inversions within the Lake Malawi ecogroups.
Principal component analysis was used to analyze SNVs identified using whole genome sequencing from 365 samples to genotype the inversion haplotype for all six inversions. (A) We illustrate the approach for genotyping the chromosome 10 inversions. The PCA plot for the entire genome is shown on the left, with each sample colored by its ecogroup. Individuals with Bionano data are shown as grey Xs. The deep benthic/shallow benthic and utaka individuals that cluster together for the whole genome analysis split into multiple clusters when analyzed using the SNVs that fall within the chromosome 10 inversion, and these clusters were assigned to inversion genotypes using samples that were genotyped using Bionano data. To make comparisons of the whole genome PCA and chromosome 10 PCA plots easier, we reversed the y-axis on the right panel. The genotypes of each sample can be found in Supplemental Table 2. Interactive PCA plots for each inversion are included in Figures S9-S17. (B) The derived allele frequency was calculated for each inversion within the seven ecogroups. The number of species that were genotyped and the estimated number of species that live in Lake Malawi are listed in the whole-genome phylogeny (left).

