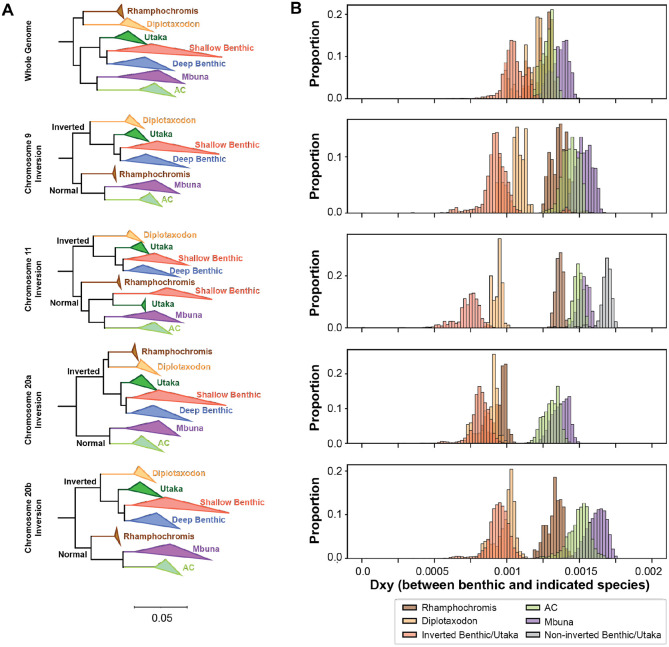
Figure 4. Evolutionary history of large inversions violates species tree.
(A) Maximum likelihood trees built from either whole genome SNVs (top) or within the 9, 11, and 20 inversions. Between 2-25 representative samples were selected for each ecogroup (see Table S2) and individuals that were heterozygous were excluded from this analysis. Clades were collapsed by ecogroup for visualization purposes. Full phylogenies are presented in Figures S18 to S25. The whole genome tree indicates Diplotaxodon and Rhamphochromis species split first and formed their own clade. For each of the displayed inversions, the first split was between samples carrying the inverted vs. normal genotypes. Additionally, the Diplotaxodon individuals now formed a clade with the benthics that carry the inversion. (B) Density plots of dXY values comparing benthic species and species of the indicated ecogroup. For the displayed inversions, the Diplotaxodon species were much closer in evolutionary distance when compared to the whole genome plot.

