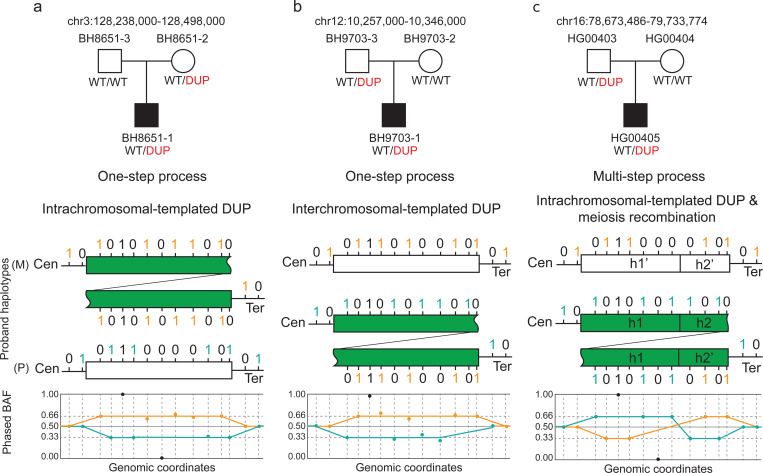
Fig. 5. Proposed Models Explaining Inconsistencies Between Read Depth and BAF Inheritance Analysis.
The top panel shows the pedigree with duplication segregation information inferred from read depth and IGV analysis. Below the pedigree are the proposed models explaining the observed BAF patterns. The two lines and rectangular segments represent two distinct haplotypes in the proband: one paternally inherited (P) and one maternally inherited (M). The green rectangle indicates the tandem duplication in the paternally inherited segment. Tick positions mark informative SNPs, with colors indicating phasing information: maternal phase (orange) and paternal phase (teal). The bottom section shows the phased B-allele frequency plot. a) Single-step model with intrachromosomal duplication; read depth analysis suggests maternally inherited duplication with expected phased BAF of maternal (0.66) and paternal (0.33) SNPs. b) Single-step model; read depth analysis suggests paternally inherited duplication but with inconsistent phased BAF of maternal (0.66) and paternal (0.33) SNPs, suggesting potential interchromosomal duplication. c) Multi-step model with intrachromosomal duplication and phased BAF swap, indicating a mixture of haplotypes in the duplication region due to meiosis recombination.

