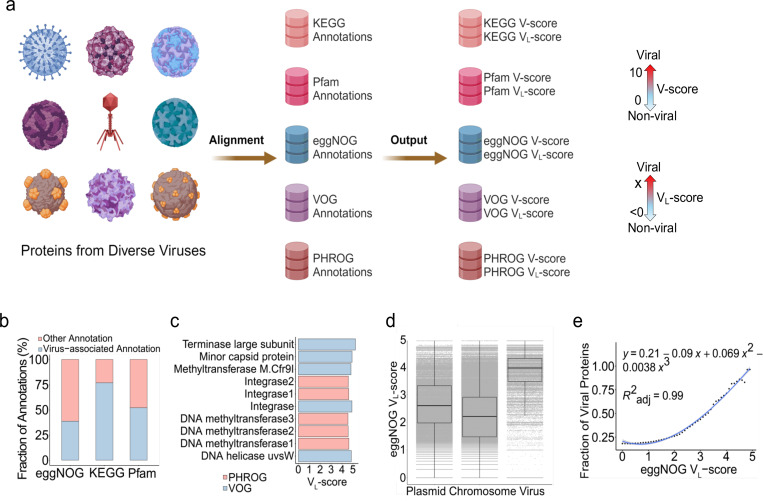
Fig. 1 |. Concepts of V-score and VL-score.
a, Workflow of V-score and VL-score generation. Nine representatives of viral taxa are shown here for the diverse viruses used in the study. A scale for VL-scores and VL-scores is displayed by two-sided arrows going from 0 to 10 and <0 to X, respectively, suggesting low scores indicate non-viral and high-scores indicate viral. b, Frequency of virus-associated annotations with V-score ≥ 0.01 and/or VL-score ≥ 0. c, Top five annotations associated with viruses based on VL-scores. d, Distribution of eggNOG VL-score across proteins from prokaryotic chromosomes (n = 7,561,596), plasmids (n = 437,241) and prokaryotic viruses (n = 83,664). The horizontal line that splits the box represents the median, upper and lower sides of the box represent upper and lower quartiles, whiskers are 1.5 times the interquartile ranges and data points beyond whiskers are considered potential outliers. e, Relationship between the fraction of viral proteins used in (d) and eggNOG VL-score. The generation of the fraction of viral proteins from the comparison between plasmids, chromosomes, and viruses is illustrated in Supplementary Fig. S10.

