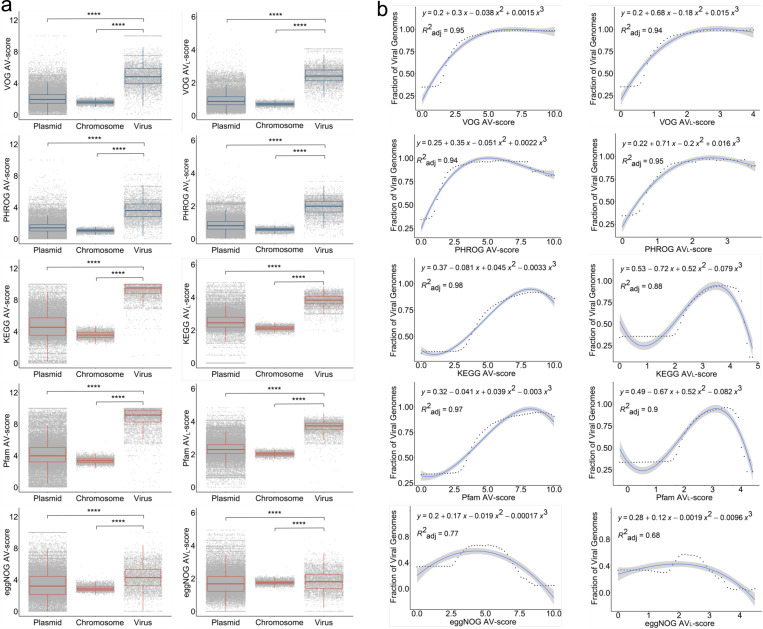
Fig. 2 |. Concepts of Average V-score (AV-score), Average VL-score (AVL-score), and cutoffs of AV-score and AVL-score.
a, Distribution of AV-score and AVL-score of prokaryotic chromosomes (n = 4,813) and the genomes of plasmids (n = 50,523) and prokaryotic viruses (n = 5,800). The blue boxes denote the AV-scores and AVL-scores of VOG and PHROG. The red boxes denote the AV-scores and AVL-scores of KEGG, Pfam, and eggNOG. The horizontal line that splits the box is the median, the upper and lower sides of the box are upper and lower quartiles, whiskers are 1.5 times the interquartile ranges and data points beyond whiskers are considered potential outliers. An ANOVA test was used to show differences between three means are significant (p < 2.2 × 10⁻¹⁶). **** denotes p < 10-4. b, Relationship between the fraction of viral genomes used in (a) and the AV-scores and AVL-scores. In this study, we define the fraction of viral genomes as the probability that a given genome sequence is viral. The dots on the dotted line represent the actual values of the fraction of viral genome sequences, while the blue lines indicate the predicted values. The process for generating the fraction of viral genome sequences is identical to the method used for generating the fraction of viral proteins, as illustrated in Supplementary Fig. S10.

