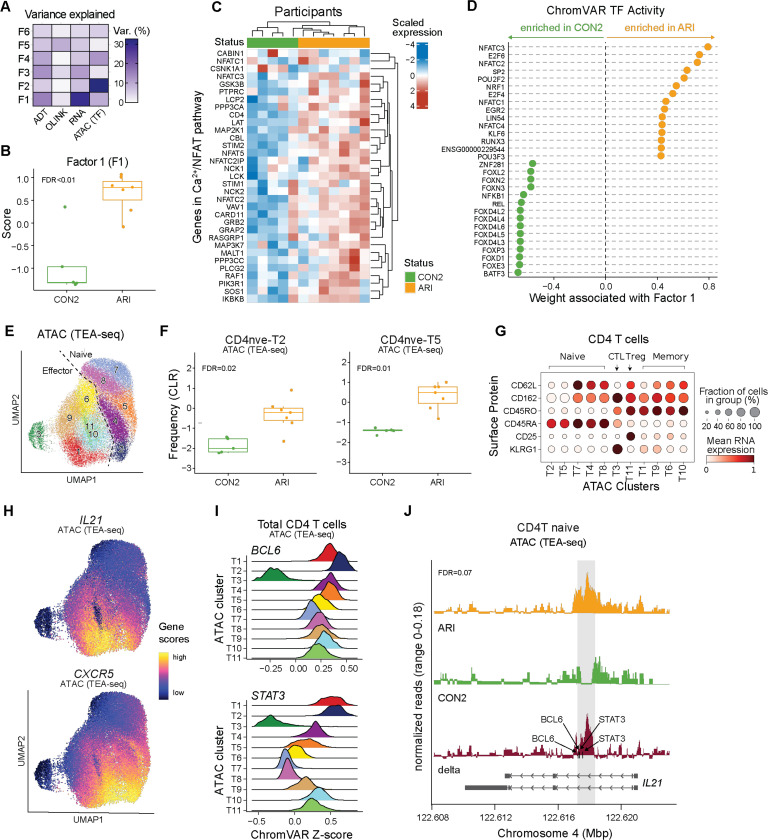
Fig. 6: Epigenetic changes in naive CD4 T cells support activation and Tfh bias in ARI.
PBMC TEA-seq experiment in a subset of ARI and CON2 samples was performed as in Fig. 3K. (A) Percentage of variance in each modality (surface protein, plasma protein, RNA, ATAC) explained by Multi-Omics Factor Analysis (MOFA) factors. (B) Factor 1 scores between ARI and CON2. (C) Scaled normalized expression of select genes in Calcium–Calcineurin–NFAT pathway in ARI and CON2. (D) Inferred accessibility for the top 15 transcription factors (TFs) positively or negatively associated with factor 1, ranked by weight. (E) Louvain clusters in CD4 T cells by ATAC modality in TEA-seq. (F) Centered log-ratio (CLR)-transformed frequencies of ATAC clusters CD4nve-T2 and CD4nve-T5 in CD4 T cells. (G) Mean surface protein expression of select markers differentiating CD4 naive, memory, Treg, and cytotoxic CD4 T cells (CTL) across ATAC clusters. (H) ATAC UMAP overlaid with inferred gene activity scores calculated by ArchR for CXCR5 and IL21. (I) ChromVAR TF activity z scores of BCL6 and STAT3 in CD4 T cells. (J) ATAC signal in ARI (orange), CON2 (green), and delta (red) at the IL21 locus. The gray box highlights a 500bp region containing differentially accessible peaks between ARI and CON2 (chr4: 122,617,500–122,617,999). Black arrows indicate the motif locations of BCL6 and STAT3 binding sites. Gene bodies are displayed on the bottom. Boxplots show median (centerline), first and third quartiles (lower and upper bound of the box) and whiskers show the 1.5x interquartile range of data. P values were determined by linear models (B, F) or zero-inflated Wilcoxon test (J). FDR values are indicated.

