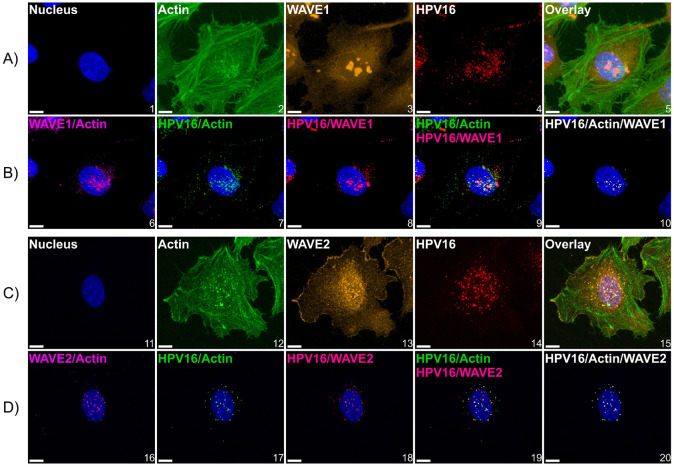
Fig 5. HPV16 colocalizes with actin and WAVE proteins at the cellular dorsal surface.
WT HeLa cells expressing LifeAct-GFP seeded in chambered microscope slides were first cooled from 37°C to 4°C for 0.5 h to inhibit endocytosis prior to the addition of HPV16 VLPs (10 ng/1E6 cells) in ice cold media for 1 hour. Cells were then returned to 37°C for 10 minutes prior to fixation with 4% paraformaldehyde for 10 minutes at room temperature, which was the temperature for subsequent steps. Samples were then permeabilized with 0.1% Triton X-100, blocked with 1% BSA, and immunostained against HPV16 L1 and (A) WAVE1 or (C) WAVE2. Hoescht 33342 was added during secondary antibody addition as a counterstain. Z-stacked images were generated via laser scanning confocal microscopy. (A and C) maximum intensity projections of Z-stacks of images depicting candidate cells. The color channels are labeled at the upper left of each image. (B and D) to analyze the spatial relationship between signals, we utilized Imaris 10.1.1 Microscopy Image Analysis Software (Oxford Instruments). Briefly, a “surface” was created for each signal, which is an Imaris segmentation algorithm. Surfaces were generated to provide object-object statistics. Parameters included the smoothing of surface details to 0.2 um with the method of absolute intensity thresholding. Background signal was subtracted through voxel size filtration (voxels smaller than 10 were excluded). Next, colocalization between channels was determined by the colocalization tool. Colocalized voxels (as determined by a Manders’ coefficient of 1) between surfaces were determined by first thresholding images to include true signals and restrict noise. New channels were then created of colocalization voxels. For both conditions, 3 fields containing 5-15 cells across 3 biological replicates were imaged. Scale = 10 μm.

