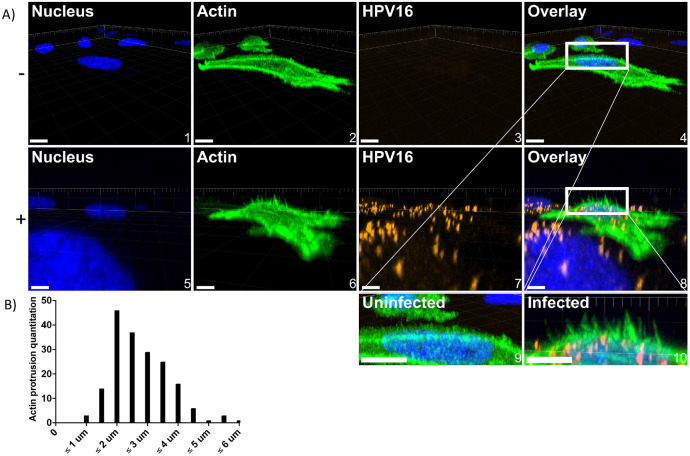
Fig 6. WT HeLa cells stimulated by HPV16 express dorsal surface actin protrusions.
Cells were prepared as described in Fig 5; however, cells were not permeabilized during immunostaining. A) either untreated (top) or HPV16 infected HeLa cells (10 ng/1E6 cells) (bottom) treated with CellLight Actin-GFP were imaged via laser scanning confocal microscopy to obtain Z-stacks. Z-stacks were then stitched together and rotated to view the XZ oriented volume. Overlaid images (4 and 8) include a white box to indicate where dorsal surface actin protrusions appear. Images 9 and 10 depict what is in the white boxes but scaled up. Scale = images 1-4, 10 μm; images 5-8, 6 μm. 20 cells were analyzed per condition. B) Actin protrusion quantification was done using Imaris. The draw tool was utilized within the Surpass Tree Item Volume with the FITC channel selected. Spheres (points) were added at the base of actin protrusions, which stemmed perpendicularly from the actin cortex. The base of filopodia was determined to be the vertex of where the filopodia and the actin cortex meet. Next, a sphere (point) was added to the distal end of the filopodia as determined by fluorescence intensity. The distance between spheres was then determined.

