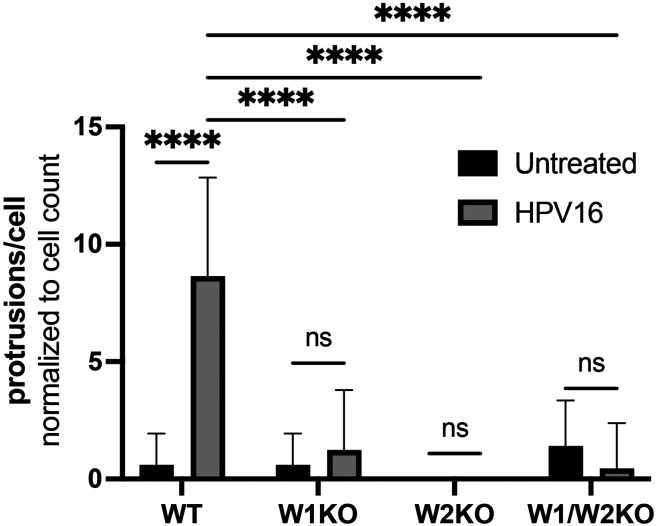
Fig 8. Knockout of WAVE1, WAVE2, or both, results in a significant reduction of dorsal surface actin protrusions.
Dorsal surface actin protrusions were quantified using the same method as described in Fig 6. The graph depicts the average number of protrusions per cell ± standard deviation. Statistics: 2-way ANOVA with comparison of means was used to statistically determine significance, corrected for multiple comparisons using Tukey’s test (ns = not significant, ****p<0.0001).

