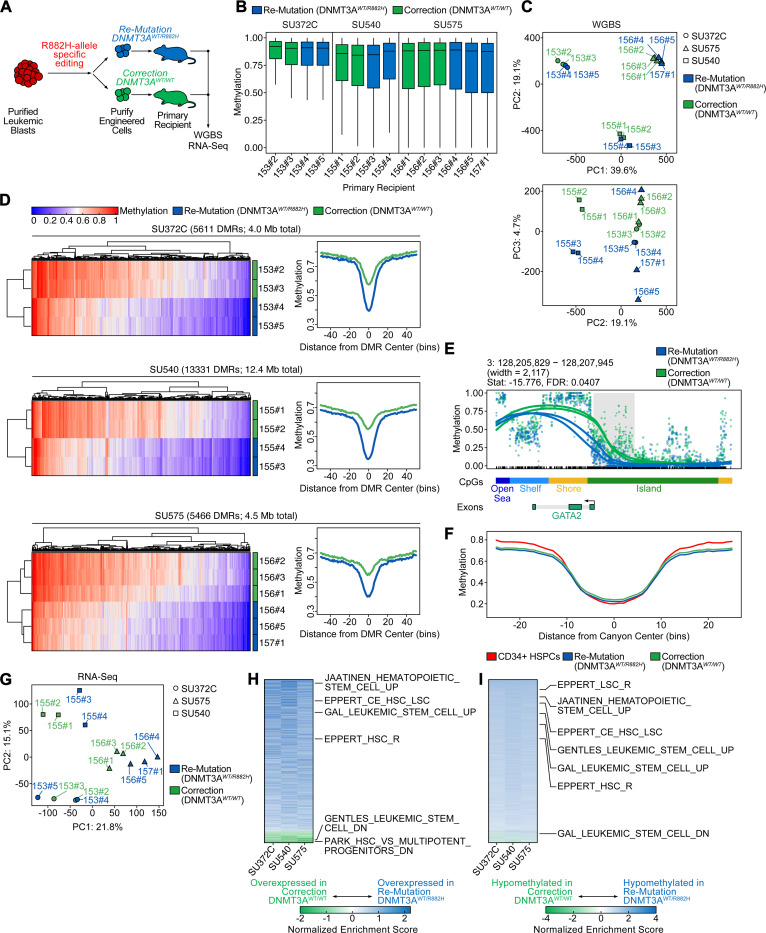
Fig. 4: Epigenetic and transcriptional identity is highly patient-specific with only minimal changes upon correction of DNMT3AR882H.
A: Schematic of sample generation for whole-genome bisulfite (WGBS) and RNA-Sequencing (RNA-Seq). Human cells were harvested from recipient mice 4 months after gene-editing. B: Average CpG methylation across the human genome for three patient specimens with either correction (green) or re-mutation (blue). Each bar represents an individual sample harvested from a primary recipient mouse (mouse ID indicated on x-axis). C: Principal component analysis of global CpG methylation from engrafted mice. Patient ID is indicated by shape and DNMT3A genotype is indicated by color. D: Methylation at differentially methylated loci (heatmaps, left) for all DMRs identified within each patient sample as well as a summary meta-region plot of methylation at DMRs normalized for width (right). DMRs in meta-region plots are extended by 2 kb for visualization of flanking regions. E: Methylation at a representative DMR (adjacent to GATA2) for patient sample SU372.C. Individual lines indicate cells harvested from separate mice, color indicates the DNMT3A genotype. F: Summary meta-region plot of methylation at methylation canyon loci from Jeong et al.41 for re-mutated (blue) or corrected (green) patient samples, as well as healthy CD34+ HSPC control (red). G: Principal component analysis of global RNA-Seq patterns from engrafted mice. Patient ID is indicated by shape and DNMT3A genotype is indicated by color. H: Gene set enrichment analysis of differential gene expression within each patient plotted as a heatmap of normalized enrichment scores (NES) sorted by descending average. Gene sets enriched in re-mutated (DNMT3AWT/R882H) are colored in blue, gene sets enriched in corrected (DNMT3AWT/WT) are colored in green. Representative gene sets relating to hematopoietic or leukemic stem cell function are highlighted. I: Gene set enrichment analysis of differential promoter methylation within each patient as a heatmap of NES sorted by descending average. Gene sets enriched in hypomethylated DMRs in re-mutated (DNMT3AWT/R882H) samples are colored in blue, and gene sets enriched in hypermethylated DMRs in re-mutated samples are colored in red. Representative gene sets relating to hematopoietic or leukemic stem cell function are highlighted.

