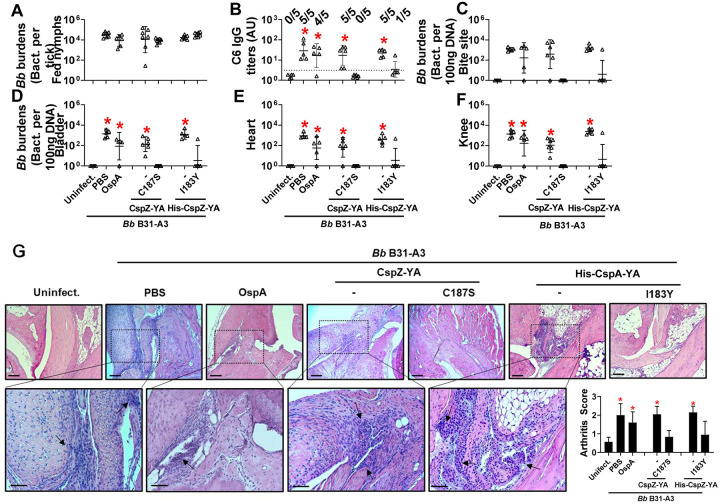
Figure 3. Immunizing twice with CspZ-YAC187S or CspZ-YAI183Y but not CspZ-YA protected mice from seroconversion, borrelial tissue colonization, and Lyme disease-associated arthritis.
(A to G) Five PBS- or lipidated OspA (OspA)-, or histidine tagged CspZ-YA (His-CspZ-YA)- or CspZ-YAI183Y (I183Y)-, or six untagged CspZ-YA- or CspZ-YAC187S (C187S)-immunized C3H/HeN mice that were immunized twice in the fashion described in Fig. 1 by indicated proteins. At 21days post last immunization, these mice were then fed on by nymphs carrying B. burgdorferi B31-A3. Mice inoculated with PBS that are not fed on by nymphs were included as an uninfected control group (uninfect.). (B) Seropositivity was determined by measuring the levels of IgG against C6 peptides in the sera of those mice at 42 days post last immunization using ELISA. The mouse was considered as seropositive if that mouse had IgG levels against C6 peptides greater than the threshold, the mean plus 1.5-fold standard deviation of the IgG levels against C6 peptides from the PBS-inoculated, uninfected mice (dotted line). The number of mice in each group with the anti-C6 IgG levels greater than the threshold (seropositive) is shown. Data shown are the geometric mean ± geometric standard deviation of the titers of anti-C6 IgG. Statistical significances (p < 0.05, Kruskal-Wallis test with the two-stage step-up method of Benjamini, Krieger, and Yekutieli) of differences in IgG titers relative to (*) uninfected mice are presented. (A, C to F) B. burgdorferi (Bb) burdens at (A) nymphs after when feeding to repletion or (C) the tick feeding site (“Bite Site”), (D) bladder, (E) heart, and (F) knees, were quantitatively measured at 42 days post last immunization, shown as the number of Bb per 100ng total DNA. Data shown are the geometric mean ± geometric standard deviation of the spirochete burdens from each group of mice. Asterisks indicate the statistical significance (p < 0.05, Kruskal Wallis test with the two-stage step-up method of Benjamini, Krieger, and Yekutieli) of differences in bacterial burdens relative to uninfected mice. (G) Tibiotarsus joints at 42 days post last immunization were collected to assess inflammation by staining these tissues using hematoxylin and eosin. Representative images from one mouse per group are shown. Top panels are lower-resolution images (joint, ×10 [bar, 160 μm]); bottom panels are higher-resolution images (joint, 2×20 [bar, 80 μm]) of selected areas (highlighted in top panels). Arrows indicate infiltration of immune cells. (Inlet figure) To quantitate inflammation of joint tissues, at least ten random sections of tibiotarsus joints from each mouse were scored on a scale of 0–3 for the severity of arthritis. Data shown are the mean inflammation score ± standard deviation of the arthritis scores from each group of mice. Asterisks indicate the statistical significance (p < 0.05, Kruskal Wallis test with the two-stage step-up method of Benjamini, Krieger, and Yekutieli) of differences in inflammation relative to uninfected mice.

