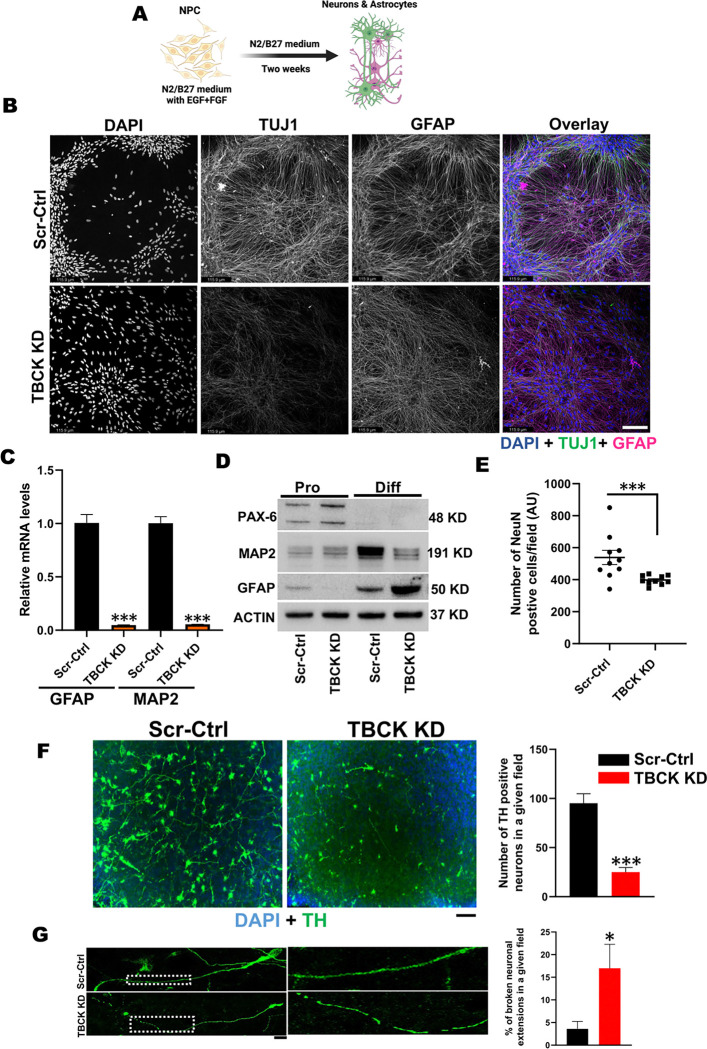
Figure 2. TBCK knockdown in ReNcells affected their neuronal and glial differentiation.
A: Pictorial representation of ReNcell differentiation into neurons and astrocytes.
B: TUJ1, GFAP, and DAPI immunofluorescence staining for differentiated Scr-Ctrl and TBCK KD ReNcells done in triplicate. Images were taken at 20X magnification, scale bar represents 115.9μm.
C: qRT-PCR analysis of MAP2 and GFAP mRNA levels in differentiated Scr-Ctrl and TBCK KD ReNcells. Error bars represent SEM. *vs. Scr-Ctrl
D: Representative Western blots of proliferating and differentiated ReNcells for PAX6, MAP2, GFAP, and Actin done in triplicate.
E: Immunofluorescence staining of NeuN followed by counting the number of NeuN-positive cells in a given field. Data is the average of three experiments.
F: Immunofluorescence staining of Scr-Ctrl and TBCK KD ReNcells differentiated to dopaminergic neurons for Tyrosine Hydroxylase (TH) and DAPI. Images were taken at 20X magnification. The number of TH positive cells in a given field is presented as a graph. Scale bar is 10μm. Error bars represent SEM. *vs. Scr-Ctrl,
G: Enlarged image showing TH positive neuronal extensions. The percentage of broken extensions in a given field is presented as a graph. Scale bar is 50μm.
Error bars represent SEM. *vs. Scr-Ctrl

