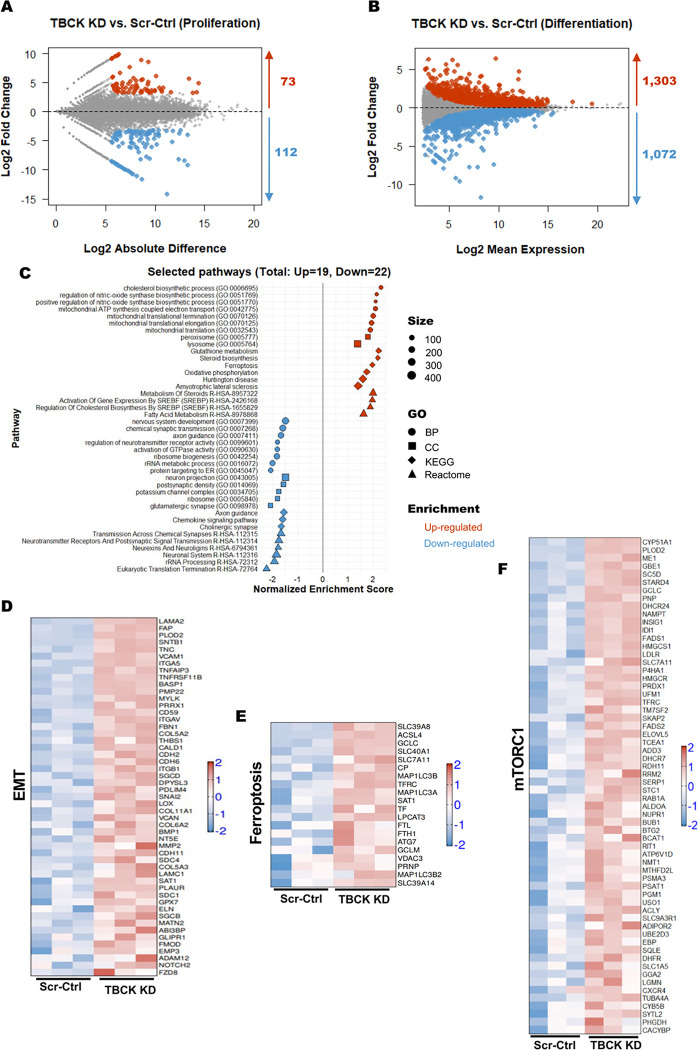
Figure 4. RNASeq analysis of Scr-Ctrl and TBCK KD ReNcells reveled different pathways for neurodegeneration.
A: MD plot of RNA-seq expression of 25,990 genes between Scr-Ctrl proliferating and TBCK KD proliferating cells. Red dots indicate differentially expressed genes that are upregulated in TBCK KD proliferating cells (Probability value > 0.9 and log2 fold change > 0), while blue dots indicate differentially expressed genes that are downregulated in TBCK KD proliferating cells (Probability value > 0.9 and log2 fold change < 0).
B: MA plot of RNA-seq expression of 57,736 genes between Scr-Ctrl differentiated and TBCK KD differentiated cells. Red dots indicate differentially expressed genes that are upregulated in TBCK KD differentiated cells (adjusted P value < 0.05 and log2 fold change > 0), while blue dots indicate differentially expressed genes that are downregulated in TBCK KD differentiated cells (adjusted P value < 0.05 and log2 fold change < 0).
C: GSEA was performed using different gene sets from Enrichr database with the significantly regulated genes from differentiated cells (TBCK KD vs. Scr-Ctrl). Selected pathways from different gene sets (Biological Process, BP; Cellular Component, CC; KEGG; Reactome) with adjusted P values (padj <0.05) are shown. The shape represents the source of different gene sets; color represents the direction of change; size represents the gene set size.
D to F: Heatmap representation of gene expression from selected pathways: (D) Epithelial Mesenchymal Transition, MSigDB hallmark gene set; (E) Ferroptosis, KEGG; and (F) mTORC1 signaling, MSigDB hallmark gene set. Log-transformed gene expression values are displayed as colors ranging from red to blue, as shown in the key. Red represents an increase in gene expression, while blue represents a decrease in expression.

