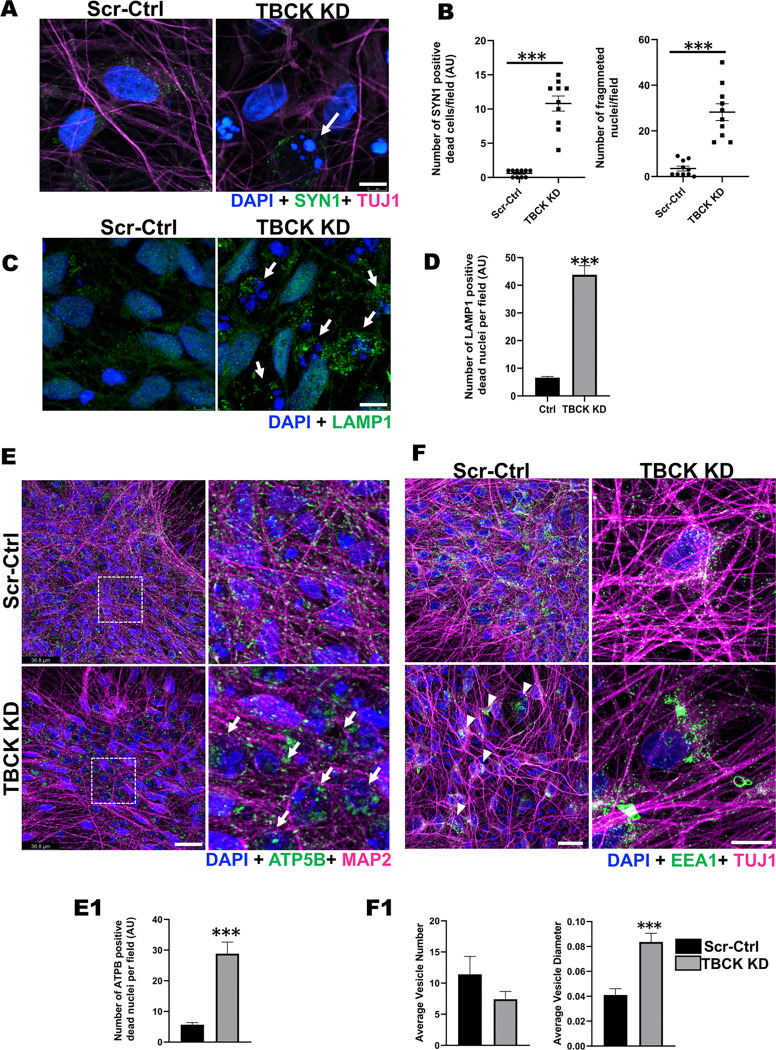
Figure 6. TBCK KD differentiated ReNcells accumulated dead cells staining for different transport proteins.
A & B: (A) Immunofluorescence staining of SYN1, TUJ1, and DAPI for differentiated Scr-Ctrl and TBCK KD ReNcells. Images were taken at 63X magnification, scale bar = 7μm. (B) The number of dead cells and dead cells positive for SYN1 is presented as a graph. Error bars represent SEM. *** vs. Scr-Ctrl.
C & D: (C) Immunofluorescence staining of LAMP1 and DAPI for differentiated Scr-Ctrl and TBCK KD ReNcells. Images were taken at 63X magnification, scale bar = 7μm. (D) The number of dead cells positive for LAMP1 is presented as a graph. Data represent an average of three experiments. Error bars represent SEM. *** vs. Scr-Ctrl.
E: Immunofluorescence staining of ATP5B, MAP2, and DAPI for differentiated Scr-Ctrl and TBCK KD ReNcells. Images were taken at 63X magnification, scale bar = 36.8μm. Panels on the right show equally zoomed in views of panels on the left outlined in dashed-white boxes. White arrows denote accumulated ATP5B. (E1) The number of dead cells positive for ATP5B is presented as a graph. Error bars represent SEM. *** vs. Scr-Ctrl
F: Immunofluorescence staining of EEA1, TUJ1, and DAPI for differentiated Scr-Ctrl and TBCK KD ReNcells. Images were taken at 63X magnification, scale bar = 50μm. (F1) Average number of vesicles in the soma and the average diameter of the vesicles are presented as a graph. Error bars represent SEM. *** vs. Scr-Ctrl. All the immunofluorescence images represent three independent experiments.

