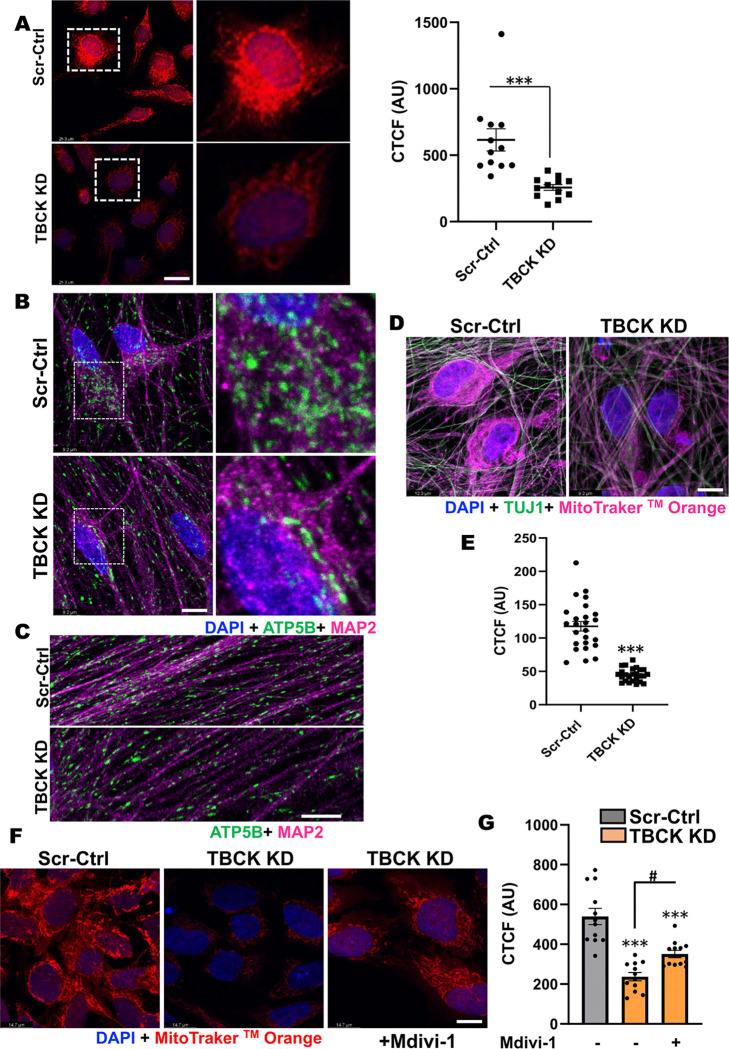
Figure 7. TBCK KD in ReNcells affected mitochondrial quality.
A: Scr-Ctrl and TBCK KD proliferating ReNcells were treated with MitoTracker™ Orange CMTMRos and DAPI. Panels on the right show equally zoomed in views of panels on the left outlined in dashed-white boxes. Scale bar is 26.3μm. The fluorescence intensity of each cell is presented as CTCF. Error bars represent SEM. *** vs. Scr-Ctrl.
B & C: (B) Immunofluorescence staining of ATP5B, MAP2, and DAPI for differentiated Scr-Ctrl and TBCK KD ReNcells. Panels on the right show equally zoomed in views of panels on the left outlined in dashed-white boxes. Images were taken at 100X magnification, scale bar is 9.2μm. (C) Enlarged images focused at neuronal extensions from Scr-Ctrl and TBCK KD cells were presented.
D: Scr-Ctrl and TBCK KD differentiated ReNcells were treated with MitoTracker™ Orange CMTMRos and counter stained for TUJ1 and DAPI. Scale bar is 9.2μm.
E: Scr-Ctrl and TBCK KD differentiated cells treated MitoTracker™ Orange CMTMRos and DAPI. The fluorescence intensity of each cell is presented as CTCF. Error bars represent SEM. ***vs. Control.
F: TBCK KD proliferating ReNcells treated with Mdivi-1 shows rescue of MitoTracker™ Orange phenotype loss observed in KD cells. Scale bar is 14.7μm.
G: Quantification of Panel F showing significant decrease of MitoTracker™ Orange in TBCK KD cells and significant increase in TBCK KD cells after treatment with Mdivi-1. The fluorescence intensity of each cell is presented as CTCF. Error bars represent SEM. ***vs. Control, #vs. Mdivi-1.

