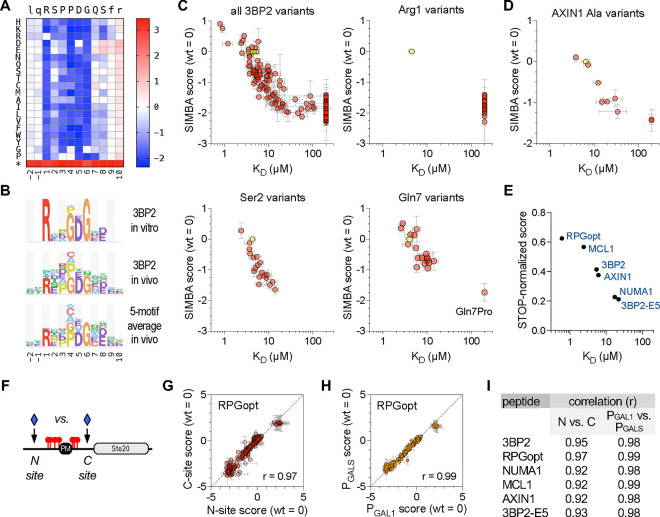
Figure 3. Interrogation of TNKS2ARC4-binding peptides by SIMBA.
(A) Heatmap showing effects of all single-position substitutions in the 3BP2 motif. Colors denote enrichment (red) or depletion (blue) relative to the wild-type motif, calculated as log scores by Enrich2 software (see Methods). The asterisk denotes a termination codon. The data average four independent experiments using PGAL1-driven TNKS2ARC4-Cln2 (two each of N-site and C-site libraries).
(B) Logos showing TNKS2ARC4 sequence preferences observed for the 3BP2 motif in vitro [54] and in vivo (this study), plus the average in vivo results from 5 distinct motifs (see also Figure S2B–D). For clarity, only positive preferences are shown (see Methods).
(C) Plots of SIMBA scores vs. KD for all 3BP2 variants as well as representative individual positions. Yellow, wild-type; pink, missense variants. SIMBA scores are mean ± SEM (n = 4). KD values [54] are the mean of technical duplicates (n = 1 ± SE of the regression fit); KD values that were not quantifiable in vitro were assigned values of 200 μM to allow inclusion in the plot. See also Figure S2A.
(D) SIMBA scores vs. KD values [54] for the wild-type AXIN1 peptide plus 9 Ala mutants, plotted as in panel (C). See also Figure S2B–D.
(E) Comparison of STOP-normalized SIMBA scores to in vitro KD [54] for 6 wild-type peptides. See also Figure S2B–D.
(F) Diagram of N-site and C-site locations for inserting SLiM sequences.
(G) Correlation of SIMBA scores for variants of the RPGopt motif in N-site vs. C-site locations. Data are the mean ± range (n = 2). See also Figure S2E.
(H) Correlation of SIMBA scores for RPGopt motif variants when the TNKS2ARC4-Cln2 fusion was expressed from different strength promoters (PGAL1 vs. PGALS). Data are the mean ± SEM (n = 4; two each of N-site and C-site libraries). See also Figure S2F.
(I) Summary of Pearson correlation coefficients (r) for the indicated pairwise comparisons. See also Figures S2E–F.

