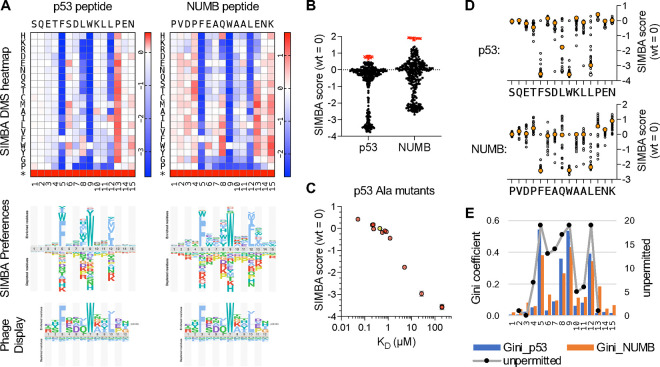
Figure 5. Determinants of binding strength for MDM2SWIB peptide ligands.
(A) Top, heatmaps of DMS results for p53 and NUMB peptides (mean, n = 2, for each peptide). Middle, sequence preference logos derived from the SIMBA scores. Bottom, logo from the ProP-PD database (https://slim.icr.ac.uk/proppd/) [33] showing residue frequencies in peptides captured by MDM2SWIB phage display; this logo is shown twice to facilitate comparison with the SIMBA preferences in each of the two peptide contexts above.
(B) Distribution of SIMBA scores for all missense variants (black circles) and the average STOP codon (red X symbols) at the 15 positions in each of the 2 parent motifs.
(C) SIMBA scores vs. KD values [65] for the wild-type p53 peptide (yellow) and 12 Ala mutants (pink). KD values that were not quantifiable in vitro were assigned as 200 μM to allow inclusion in the plot.
(D) Plot of SIMBA scores for Ala residues (large, orange-filled circles) vs. all other residues (small, unfilled circles) at each position in the p53 and NUMB peptides.
(E) Bars show Gini coefficients, calculated from normalized SIMBA scores, for each position in the p53 and NUMB peptides. Black dots connected by a grey line show previous scoring of the number of unpermitted substitutions at each position of an optimized MDM2SWIB-binding peptide (MPRFMDYWEGLN) [66].

