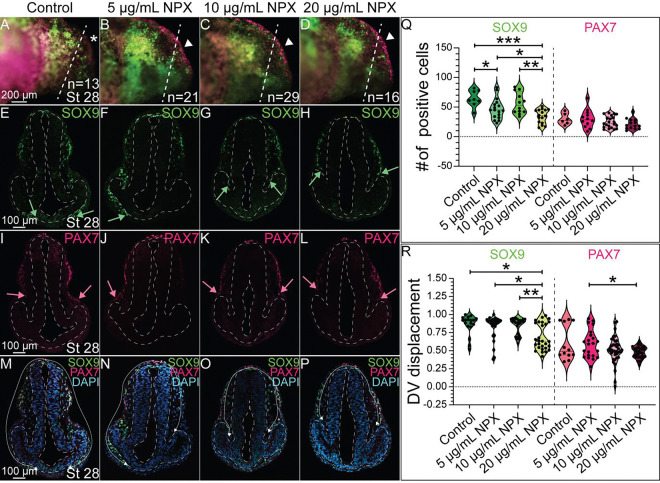
Figure 4. NPX exposure reduces the migration of SOX9+ cells into the developing cranial region.
IHC for SOX9 and PAX7 in (A-D) whole mount and (E-P) transverse sections of stage 28 axolotl embryos. (A-D) Dashed lines show the axial level in the head that corresponds to the transverse sections. Arrowheads highlight superficial PAX7 expression which appears increased in (B-D) treated embryos compared to PAX7 expression in the (A) control embryos marked by the asterisk. (E-P) Dashed lines outline the neural tube and developing eyes in transverse section. (E-H) Green arrows indicate the extent of migration of SOX9+ NC cells in the cranial region. (I-L) Pink arrows indicate the migration of PAX7+ NC cells into the ventrolateral region of the developing head (M-P) The white arrows demonstrate the migratory path of NC cells into the ventral face. (Q) Quantification of the number of SOX9+ or PAX7+ cranial NC cells based on degree of NPX exposure. (R) Quantification of the migration distance of SOX9+ or PAX7+ NC cells, measured as DV displacement, in transverse section. For SOX9 analysis, the following sample sizes were used: n=4, n=5, n=5, and n=6 embryos for the control, 5 μg/mL NPX, 10 μg/mL NPX, and 20 μg/mL NPX groups, respectively, with an average of 3 transverse sections analyzed per embryo. Similarly, for PAX7 analysis, the sample sizes were n=2, n=5, n=6, and n=6 embryos for the respective treatments, and an average of 3 transverse sections were analyzed per embryo.

