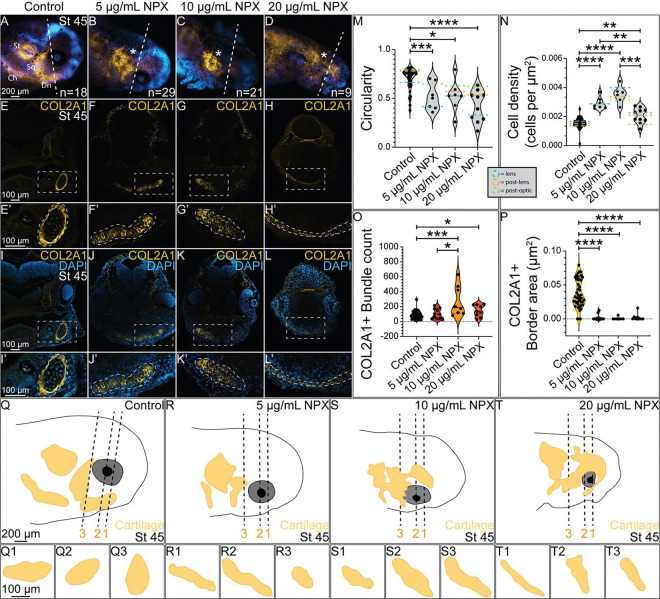
Figure 5. COX inhibition causes abnormal formation of cranial cartilage structures.
IHC for COL2A1 in (A-D) wholemount and (E-L) transverse sections from stage 45 axolotls. (A-D) Dashed line indicates axial level of sections in (E-L). Asterisks mark abnormal COL2A1 localization. (E-L) Dashed boxes indicate region of zoom in. (E’-L’) Enlarged images of Meckel’s cartilage show abnormal tissue morphology and COL2A1 localization following NPX exposure. Dashed outlines highlight the developing chondrocytes within Meckel’s cartilage expressing COL2A1. (M-P) Quantification of circularity and cell density of Meckel’s cartilage, along with quantification of the number of COL2A1+ bundle structures within Meckel’s cartilage and the total area of the COL2A1+ band surrounding Meckel’s cartilage in cross section. Green, orange, and blue dashed lines on the violin plots in M-N indicate the average circularity or cell density values at each axial level (lens= blue, post-lens= orange, and post-optic= green) across the 4 treatment groups. For analysis of COL2A1, the sample sizes analyzed were n=4, n=4, n=2, and n=2 for the respective treatment groups. (Q-T) Drawings of wholemount stage 45 axolotl embryos in A-D with the developing COL2A1+ cranial cartilages drawn in the yellow structures. Dashed lines indicate the axial levels that were analyzed in the circularity and cell density analysis of Meckel’s cartilage in M-N (1 = lens, 2 = post-lens, and 3 = post-optic). (Q1-Q3, R1-R3, S1-S3, and T1-T3) Drawings of transverse sections through Meckel’s cartilage at each axial level across treatment groups. St= supratemporal cartilage, Ch= ceratohyal, Sq= squamate, Dn= dentate (Meckel’s cartilage).

