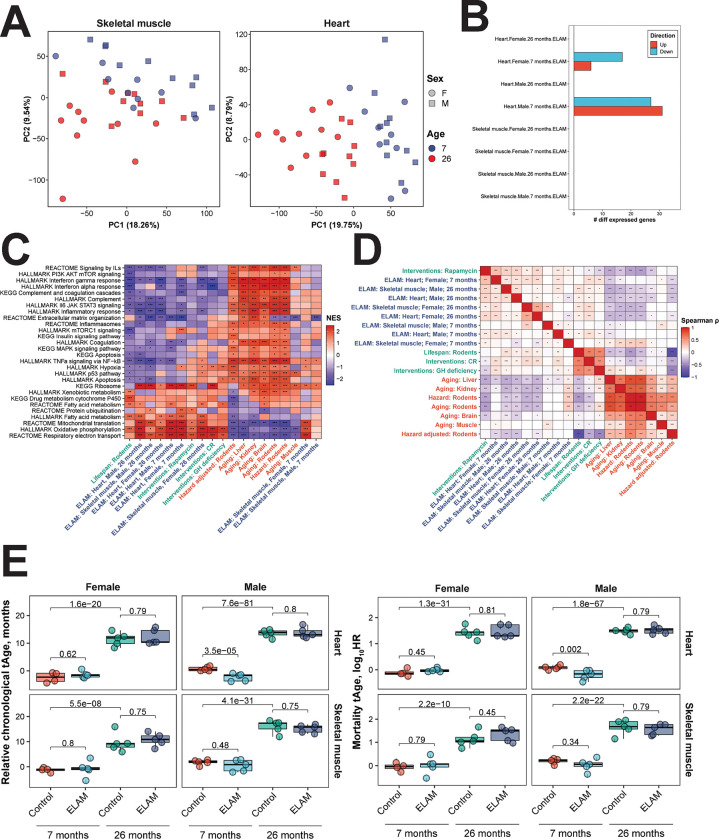
Figure 2: Effect of 2-months ELAM treatment on the transcriptome of young and old mouse heart and skeletal muscle tissues.
A. Principal components analysis (PCA) of mRNA-seq samples. PCA was performed following filtering of genes with low numbers of reads and RLE normalization64. B. Number of differentially expressed genes following ELAM treatment. Differentially expressed genes were determined using edgeR66 separately for males and females. P-values were adjusted for multiple comparisons using the Benjamini-Hochberg method, and the False Discovery Rate (FDR) was set at 5%. C. Gene set enrichment analysis (GSEA) of pathways affected by signatures of aging, mortality, lifespan-extending interventions, and ELAM treatment. Normalized enrichment scores (NES) of aging-related pathways affected by ELAM treatment (blue), lifespan-increasing interventions (green), and signatures of aging and mortality (red). GH: grown hormone deficiency, CR: caloric restriction. ‘adjusted p-value < 0.1, *adjusted p-value < 0.05, **adjusted p-value < 0.01, ***adjusted p-value < 0.001. D. Correlation analysis of gene expression changes induced by ELAM treatment at the level of enriched pathways. Spearman correlation between normalized enrichment scores (NES) from gene set enrichment analysis (GSEA) performed for signatures of ELAM treatment (blue), lifespan-extending interventions (green), and mammalian aging and mortality (red). ‘adjusted p-value < 0.1, *adjusted p-value < 0.05, **adjusted p-value < 0.01, ***adjusted p-value < 0.001. E. Effect of ELAM treatment on predicted transcriptomic age (tAge) of mouse heart and skeletal muscle tissues. Mouse multi-tissue transcriptomic clocks of relative chronological age (left) and mortality (right) have been applied. Benjamini-Hochberg adjusted p-values comparing young vs. old animals, and sex- and age-matched control vs. ELAM treated mice are shown in text.

