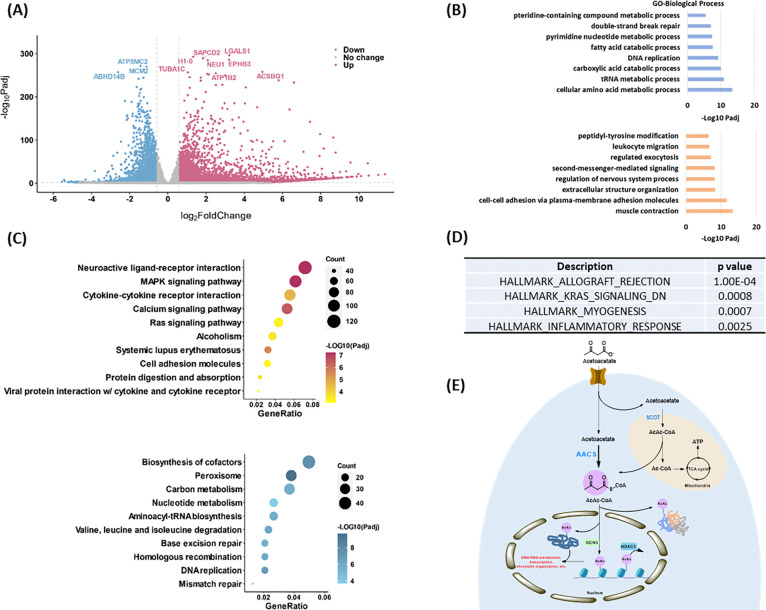
Fig. 6. Profiling of physiological relevance of Kacac mark in HEK293T cells.
(A) Volcano plot analysis of pairwise comparison of RNA-seq results from HEK293T cells with or without 20 mM acetoacetate treatment. (B) GO (Biological process) enrichment analysis of downregulated (blue) and upregulated (orange) differentially expressed genes (DEGs) after lithium acetoacetate treatment in HEK293T cells, ranked on the basis of adjusted p values. (C) Bubble plots showing the top 10 KEGG pathways enriched in the upregulated (upper) and downregulated (bottom) DEGs after lithium acetoacetate treatment in HEK293T cells, ranked on the basis of adjusted p values and counts. Gradient colors represent enriched significance, and size of circles represents numbers of DEGs. (D) Hallmark gene sets identified by GSEA after lithium acetoacetate treatment in HEK293T cells, ranked on the basis of P values. (E) A graphical model of Kacac. In this model, AACS, not SCOT, is a major player for AcAc-CoA and Kacac generation from acetoacetate.

