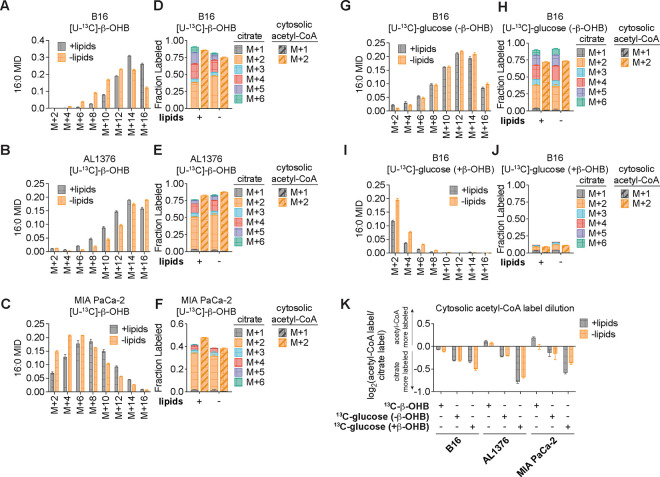
Figure 2. β-OHB is preferentially used over glucose for fatty acid synthesis.
A-C, 16:0 mass isotopomer distribution (MID) for B16 (A), AL1376 (B), and MIA PaCa-2 (C) cells labeled with [U-13C]-β-OHB for 48 h in lipid-replete versus lipid-depleted culture media. D-F, Citrate MID (solid bars) and cytosolic acetyl-CoA MID (dashed bars) for B16 (D), AL1376 (E), and MIA PaCa-2 (F) cells labeled with [U-13C]-β-OHB for 48 h in lipid-replete versus lipid-depleted culture media. G-J, 16:0 MID (G, I) and citrate and cytosolic acetyl-CoA MID (H, J) for B16 cells labeled with [U-13C]-glucose for 48 h in lipid-replete versus lipid-depleted culture media, either without unlabeled β-OHB (G, H) or with 5 mM unlabeled β-OHB (I, J). K, Cytosolic acetyl-CoA label dilution from citrate, as calculated by the log2(fold change) of the total fraction of cytosolic acetyl-CoA labeled versus the total fraction of citrate labeled, in B16, AL1376, and MIA PaCa-2 cells under the indicated tracing conditions. Data are presented as mean ± s.e.m; n = 3 biologically independent replicates.

