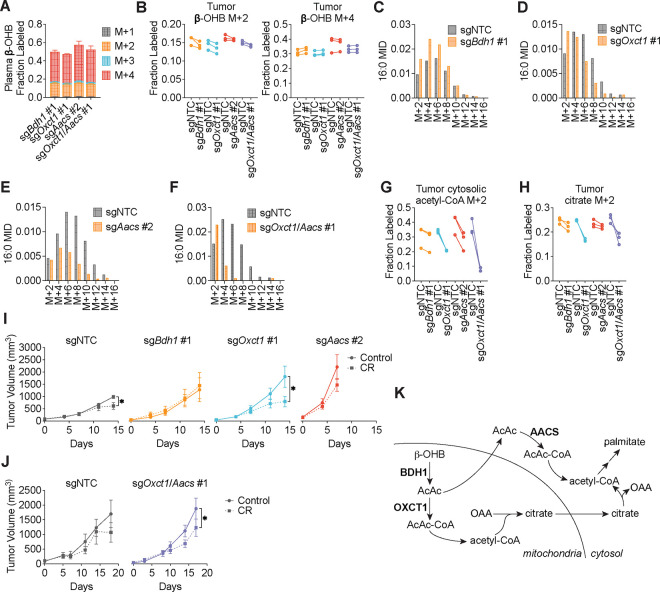
Figure 4. β-OHB contributes to fatty acid synthesis through both OXCT1 and AACS in tumors in vivo.
C57BL/6J mice bearing a B16 sgNTC tumor on one flank and a knockout tumor on the other flank were infused with [U-13C]-β-OHB for 6.5 h. A, Plasma β-OHB labeling in mice bearing the indicated knockout tumors. B, [M+2] and [M+4] fractional labeling of β-OHB in the indicated sgNTC versus knockout tumors. Data are paired between sgNTC and knockout tumors from the same mouse. n = 3 biological replicates for each knockout tumor. C-F, Representative 16:0 MIDs from n = 1 biological replicate of a mouse bearing an sgNTC tumor versus a sgBdh1 #1 tumor (C), sgOxct1 #1 tumor (D), sgAacs #2 tumor (E), and sgOxct1/Aacs #1 tumor (F). See Extended Data Fig. 5 for additional biological replicates. G, H, [M+2] fractional labeling of cytosolic acetyl-CoA (G) and citrate (H) in the indicated sgNTC versus knockout tumors. Data are paired between sgNTC and knockout tumors from the same mouse. n = 3 biological replicates for each knockout tumor. I, J, Tumor volumes of subcutaneous B16 sgNTC, sgBdh1 #1, sgOxct1 #1, sgAacs #2 (I), and sgOxct1/Aacs #1 (J) allografts in male mice exposed to a control or caloric restriction (CR) diet. (I) sgNTC Control n = 6 mice, CR n = 6 mice; sgBdh1 #1 Control n = 6 mice, CR n = 6 mice; sgOxct1 #1 Control n = 5 mice, CR n = 5 mice; sgAacs #2 Control n = 6 mice, CR n = 6 mice. (J) sgNTC Control n = 3 mice, CR n = 4 mice; sgOxct1/Aacs #1 Control n = 4 mice, CR n = 4 mice. K, Schematic of β-OHB contribution to fatty acid synthesis through both a mitochondrial citrate-dependent route via OXCT1 and a citrate-independent route via AACS. Data are presented as mean ± s.e.m. Comparisons were made using a two-way ANOVA (I, J). *P<0.05.

