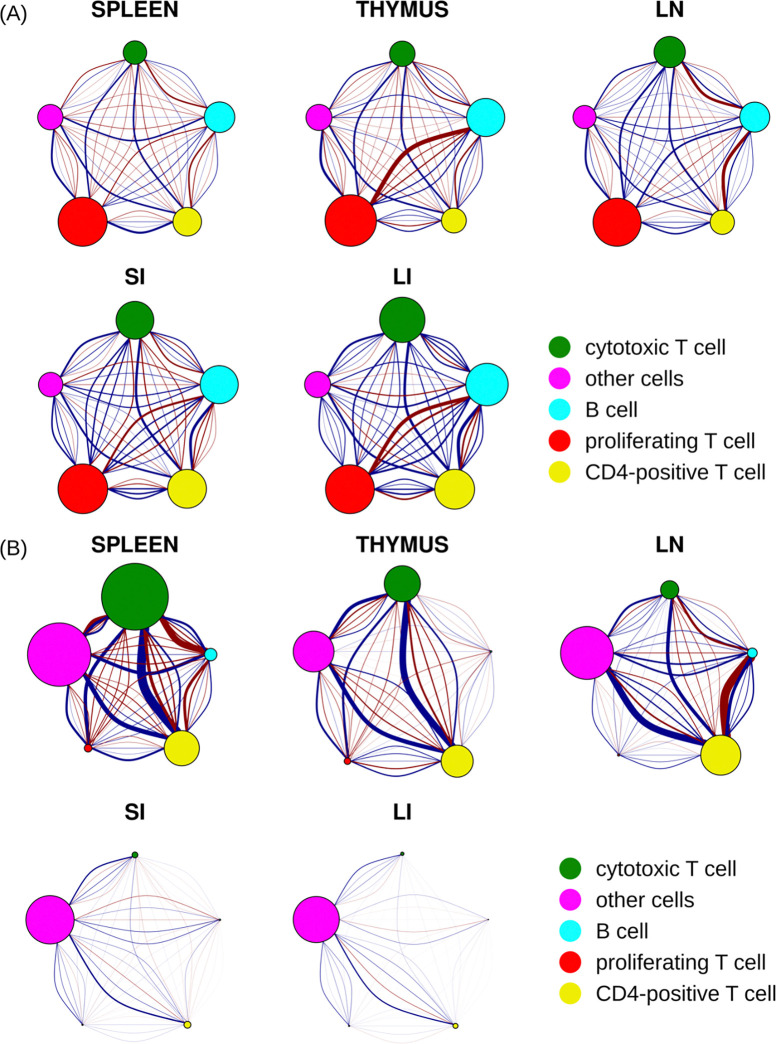
Figure 6.
Spatial relationships between five cell types across five different tissues. The size of each node corresponds to the total strength of self-interaction across five distance ranges for that cell type (see Figure S4 for strength of self-interaction at each range). Each pair of nodes is interconnected by five arcs, each representing a different distance range. The range increases from left to right or from bottom to top, with the smallest and farthest ranges corresponding to the most curved arcs. The strength of the relationship between two cell types is depicted by the thickness of the arc, while the nature of their interaction is indicated by the color of the arc (blue as attraction and red as repulsion). (A) A direct, unfiltered illustration by raw interaction coefficients (B) Interaction coefficients adjusted by base intensities of corresponding cell types.

