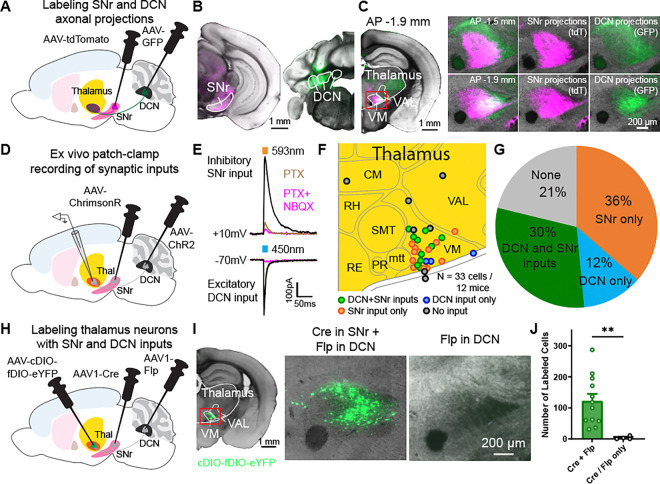
Figure 1: Neurons in motor thalamus receive converging synaptic inputs from SNr and DCN projections.
(A) Schematic diagram of virus injections for viral tracing of SNr and DCN axonal projections.
(B) Coronal sections showing AAV-tdTomato (magenta) expression in SNr (left) and AAV-GFP (green) in DCN (right). Scale bar, 1 mm.
(C) Coronal sections showing axonal projections from ipsilateral SNr and contralateral DCN in the thalamus. Left: Hemisphere with SNr axons expressing AAV-tdTomato (magenta) and DCN axons expressing AAV-GFP (green) at 1.9 mm posterior of Bregma. Scale bar, 1 mm. Right: Enlarged images of motor thalamus (red rectangle in image on the left) at 1.5 mm (top) and 1.9 mm (bottom) posterior of Bregma. Scale bar, 200 μm.
(D) Schematic diagram of virus injections for dual-color optogenetic stimulation and whole-cell patch clamp experiments.
(E) Example whole-cell patch clamp recording traces of oIPSC and oEPSC responses in a thalamic neuron to stimulation of SNr inputs with ChrimsonR and DCN inputs with ChR2. oIPSCs (black) were blocked by PTX application (dark magenta), oEPSCs (black) were blocked by NBQX application (light magenta).
(F) Location of recorded neurons, colored by their input type. Recorded neurons from different AP sections (1.3–1.9 mm posterior of Bregma) shown on one map for clarity.
(G) Fraction of neurons receiving functional SNr and/or DCN inputs. Data in F and G are from a mix of mice expressing ChrimsonR in SNr and ChR2 in DCN or vice versa. N=33 cells from 12 mice.
(H) Schematic diagram of virus injections for transsynaptic viral tracing of SNr and DCN neurons projecting onto thalamic neurons.
(I) Coronal section showing neurons in the thalamus receiving dual inputs from SNr and DCN. Left: Hemisphere with neurons expressing AAV-cDIO-fDIO-eYFP (green) in a mouse injected with AAV1-Cre in the SNr and AAV1-Flp in the DCN. Scale bar, 1 mm. Middle: Enlarged image of motor thalamus (red rectangle in image on the left). Right: Motor thalamus in control mice injected with only AAV1-Cre or AAV1-Flp in SNr/DCN and AAV-cDIO-fDIO-eYFP in thalamus.
(J) Quantification of labeled cells from two coronal sections in mice expressing AAV-cDIO-fDIO-eYFP in thalamus and AAV1-Cre in SNr and AAV1-Flp in DCN (or vice versa) and control mice. Bars denote mean and circles individual mice. Error bars, SEM. Cre+Flp: 122.1±23.13 cells, n=12 mice; Cre/Flp only: 3.5±2.6 cells, n=4 mice. p=0.001, Mann-Whitney test.
**p<0.01

