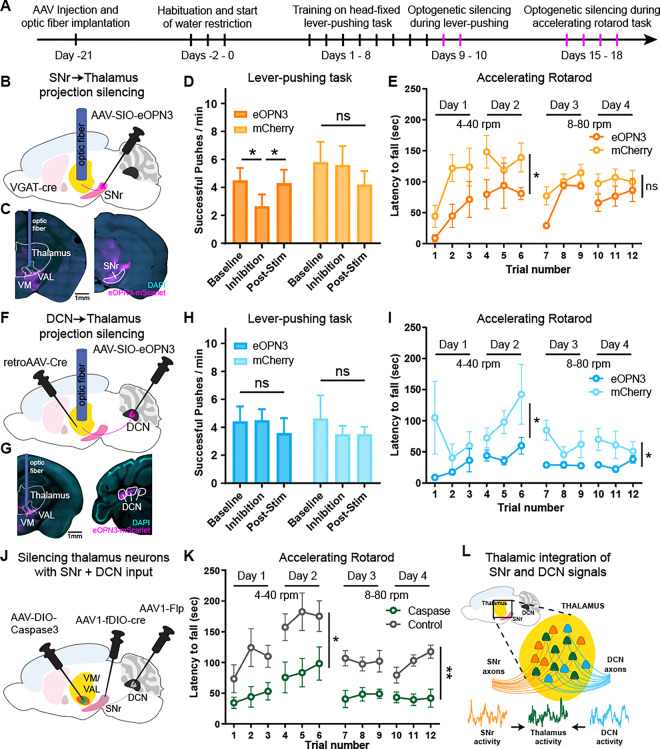
Figure 4: Silencing SNr and DCN inputs to thalamus and dual-input thalamus neurons impairs motor behaviors.
(A) Timeline of surgeries and behavior experiments for optogenetic silencing of SNr and DCN projections to the thalamus. Optogenetic silencing sessions are labeled in magenta.
(B) Schematic diagram of virus injections and optic fiber placement for optogenetic inhibition of SNr projections to thalamus.
(C) Example coronal sections showing AAV-eOPN3 (magenta) expression and optic fiber placement. Scale bar, 1 mm.
(D) Lever-push performance of mice expressing eOPN3 in SNr (dark orange) and control mice expressing mCherry (light orange). Number of successful lever pushes shown before (baseline), during (inhibition), and after (post-stim) optogenetic silencing of SNr to thalamus projections. Silencing was performed in mice well-trained on the head-fixed lever-pushing task. Bars denote mean. Error bars, SEM. eOPN3: n=7 mice; mCherry: n=5 mice. Two-way ANOVA with Holm-Sidak multiple comparisons test.
(E) Performance on an accelerating rotarod task of mice expressing eOPN3 in SNr (dark orange) and control mice expressing mCherry (light orange). SNr to thalamus projections were unilaterally silenced during each training session. Circles denote mean. Error bars, SEM. eOPN3: n=4 mice; mCherry: n=7 mice. Two-way ANOVA, separately for days 1–2 and days 3–4.
(F) Schematic diagram of virus injections and optic fiber placement for optogenetic inhibition of DCN projections to thalamus.
(G) Example coronal sections showing AAV-eOPN3 (magenta) expression and optic fiber placement. Scale bar, 1 mm
(H) Lever-push performance of mice expressing eOPN3 in DCN (dark blue) and control mice expressing mCherry (light blue). Number of successful lever pushes shown before (baseline), during (inhibition), and after (post-stim) optogenetic silencing of DCN to thalamus projections. Silencing was performed in mice well-trained on the head-fixed lever-pushing task. Bars denote mean. Error bars, SEM. eOPN3: n=8 mice; mCherry: n=7 mice. Two-way ANOVA with Holm-Sidak multiple comparisons test.
(I) Performance on an accelerating rotarod task of mice expressing eOPN3 in DCN (dark blue) and control mice expressing mCherry (light blue). DCN to thalamus projections were bilaterally silenced during each training session. Circles denote mean. Error bars, SEM. eOPN3: n=10 mice; mCherry: n=8 mice. Two-way ANOVA, separately for days 1–2 and days 3–4.
(J) Schematic diagram of virus injections for ablating thalamic neurons receiving SNr and DCN inputs using Caspase3.
(K) Performance on an accelerating rotarod task of mice with bilaterally ablated thalamic neurons receiving SNr and DCN inputs (green) and control mice injected with Caspase3 but no Flp and Cre (gray). Circles denote mean. Error bars, SEM. Caspase: n=6 mice; Control: n=7 mice. Two-way ANOVA, separately for days 1–2 and days 3–4.
(L) Proposed model with a fraction of neurons in thalamus (mainly VM and VAL) receiving inputs from SNr and DCN. Neuronal activity from SNr and DCN is integrated in these thalamic neurons and their activity is critical for proper motor learning and execution.
ns: not significant, *p<0.05, **p<0.01

