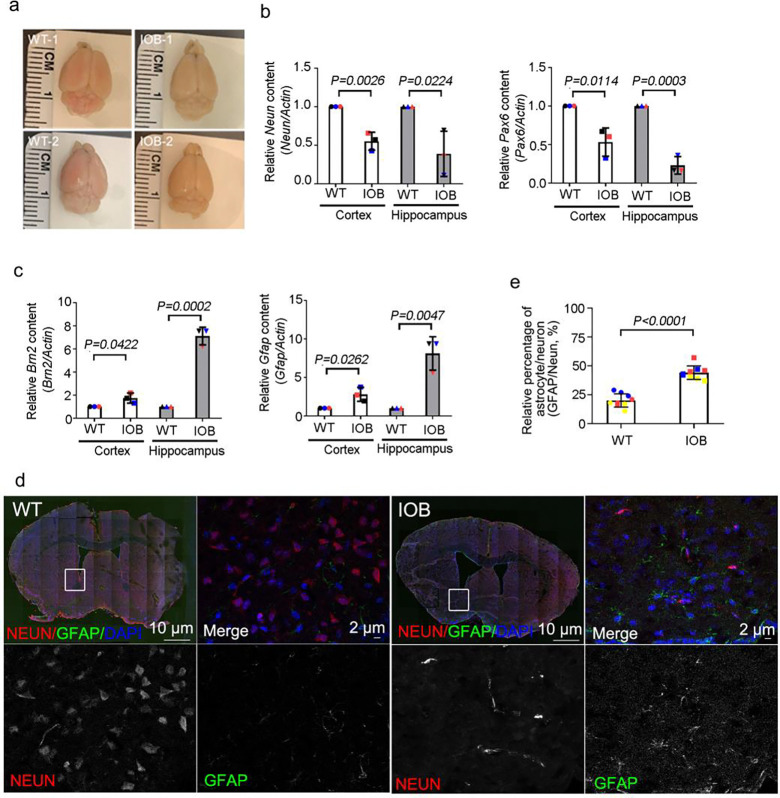
Figure 3. Elevated astrocyte population during neuronal differentiation in Lowe syndrome mouse model.
(a) Images showing brain of wild-type and IOB mouse. (b) Quantitative real-time PCR (RT-PCR) validation of Neun and Pax6 in brain sections. RT-PCR was repeated three times with different batches. Gene expression values are normalized to actin. (c) Quantitative real-time PCR (RT-PCR) validation of Brn2 and Gfap in brain tissues. RT-PCR was repeated three times with different batches. Gene expression values are normalized to actin. (d) Wild-type and IOB mouse brain section stained with Neun (red) and GFAP (green) antibodies. DNA stained with DAPI (blue). Scale bars are as indicated. (e) Quantification of the ratio of Neun and GFAP signals in brain section(s) of wild-type and IOB mouse. > 100 cells analyzed for each independent experiment. The bars in each graph represent mean ± SD. Statistical significance was determined using Student’s t-test, with exact p-values reported.

