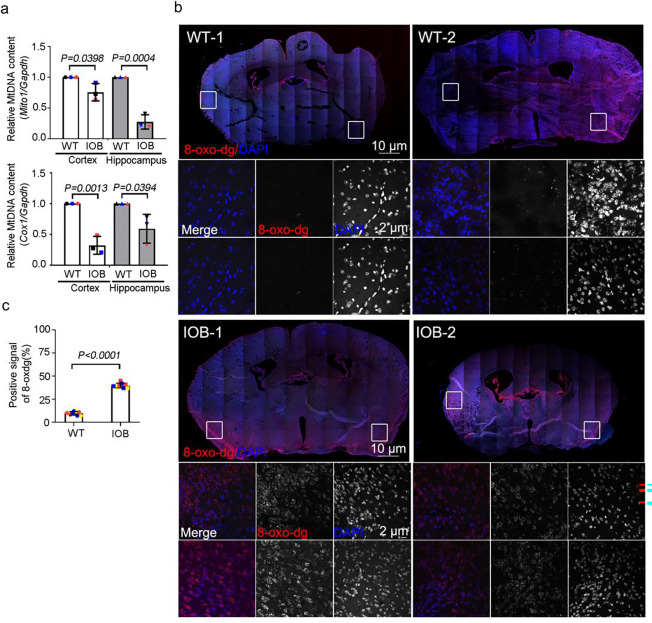
Figure 4. Mitochondrial defects in the brain of Lowe syndrome mouse model.
(a) Quantitative real-time PCR (RT-PCR) validation of mitochondrial DNA genes Cox2 and Dloop in brain sections of wild-type and IOB mouse. RT-PCR was repeated three times with different batches. Gene expression values are normalized to Actin. (b) Brain sections of wild-type and IOB mouse stained with 8-oxo-dg (red) antibody. DNA stained with DAPI (blue). Scale bars are as indicated. (c) Quantification of the positive percentage of 8-oxo-dg signals in brain sections of wild-type and IOB mouse > 100 cells analyzed for each independent experiment. The bars in each graph represent mean ± SD. Statistical significance was determined using Student’s t-test, with exact p-values reported.

