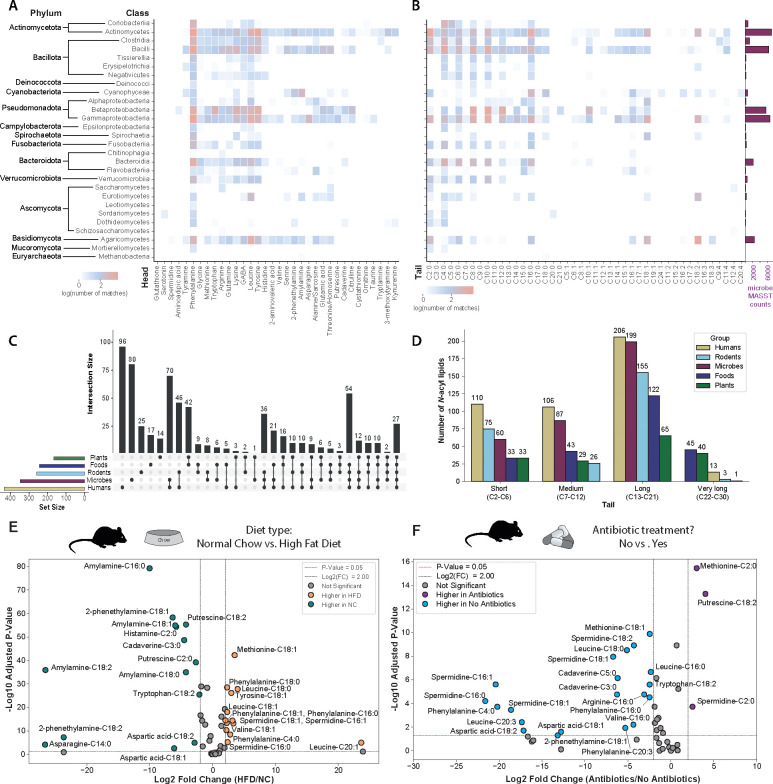
Figure 2. Evidence of microbial origins of N-acyl lipids.
Heatmaps depict the distribution of different headgroups (A) and tails (B) across various microbial classes, with barplots showing the total counts for each class in microbeMASST.15 The Y-axis was taxonomically ordered according to the NCBI Taxonomy ID, while the X-axis was clustered using the Braycurtis metric for the headgroups, or in ascending order (in number of carbons and unsaturations) for the tails. C) UpSet plot of N-acyl lipid distribution: This plot highlights the distribution of N-acyl lipids across different datasets, including human-related, rodent-related, microbial monocultures, plant-, and food-associated data. D) Distribution of N-acyl lipid chain lengths: This summary shows the prevalence of short, medium, long, and very long chain N-acyl lipids in public data. Note that the exact location and cis/trans configurations of double bonds cannot be determined from the current queries, which are annotated at the molecular family level according to the Metabolomics Standards Initiative.27 E and F) Volcano plots of mouse fecal pellets from a dataset publicly available (GNPS/MassIVE: MSV000080918)30 showing N-acyl lipids up-regulated and down-regulated upon different diets (E) and antibiotic treatment (F). The significant thresholds are marked by dotted lines in the volcano plot (p < 0.05 and log2(FC) > 2 or <2). Differential compounds between the groups were evaluated using the non-parametric two-sided Mann-Whitney U test, and p-values were corrected for multiple comparisons using the Benjamini-Hochberg correction. Icons were obtained from Bioicons.com.

