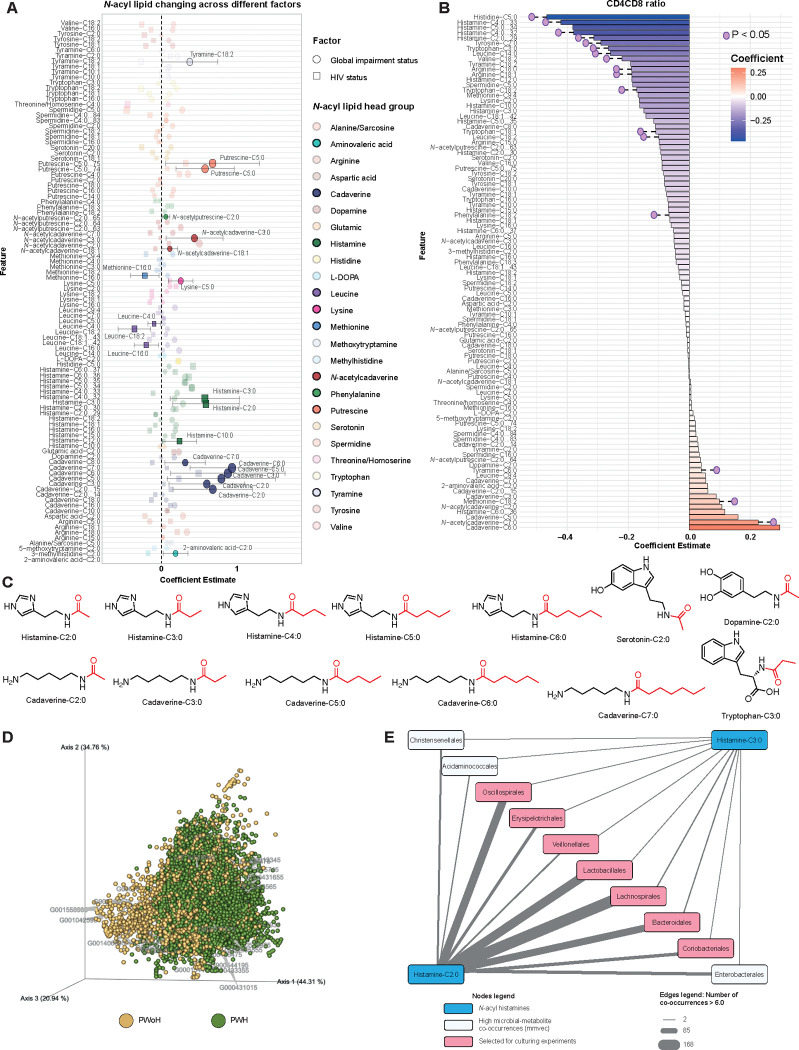
Figure 3. N-acyl lipids are correlated with HIV and neurocognitive impairment status.
(A) Forest plot illustrating the coefficient estimate of a linear mixed-effects model for individual N-acyl lipid species, with fixed covariates of HIV status (PWH, n = 226; PWoH, n = 87) and neurocognitive impairment status (impaired, n = 151; unimpaired, n = 162), accounting for random effects within individual samples/visit. Filled circles (HIV status) and squares (neurocognitive impairment status) with corresponding confidence intervals represent significant N-acyl lipid species. Faded circles and squares depict non-significant species. Each color represents a different headgroup. (B) Bar plot showing the correlation coefficients of association between CD4/CD8 ratio and various N-acyl lipids in a subset of the PWH (n = 171) with available metadata. Red bars represent positive correlations, while blue bars represent negative correlations, as determined by linear regression models. The p-values shown are nominal; adjusted p-values (corrected for multiple comparisons using the Benjamini-Hochberg method) are available in Supplementary Table S3. (C) Structures of all N-acyl lipids confirmed in this study with pure synthetic standards. (D) Microbe-metabolite co-occurrence biplot obtained from mmvec40 analysis of the HNRC sample. Spheres represent ions of molecules, while arrows represent microbes. Spheres were colored based on which group (PWH vs. PWoH) each ion feature was most abundant in. Small angles between the arrows indicate microbes co-occurring with each other, and spheres close in the plot represent features co-occurring. Arrows pointing toward a group of molecules indicate microbe-molecule co-occurrence. This biplot shows the 30 most important OTUs (higher vector magnitude). (E) Network of the microbial taxonomic orders with co-occurrences > 6.0 and shared between histamine-C2:0 and histamine-C3:0. Nodes colored in pink are the orders selected for culturing experiments.

