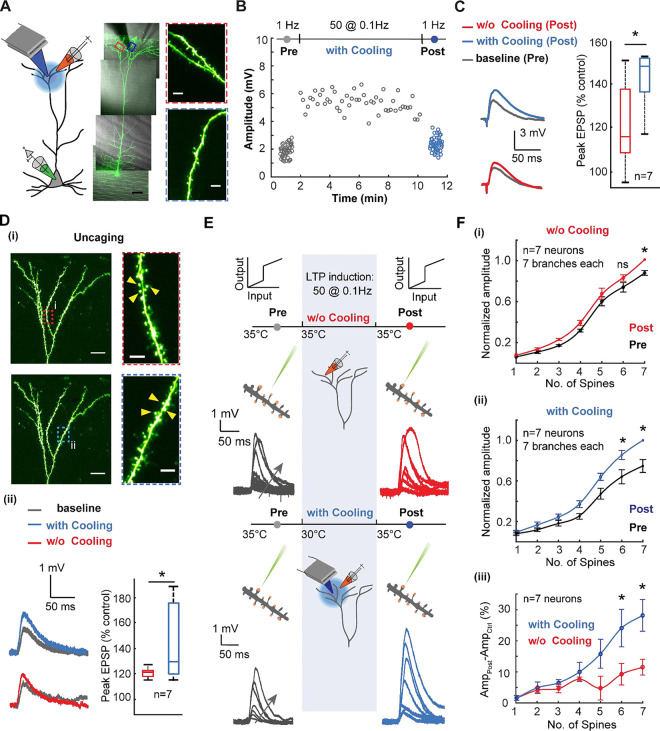
Fig. 1. Mild focal cooling amplifies tuft dendritic plasticity and excitability.
A) Schematic depicting low-frequency stimulation-induced plasticity in tuft dendrites under mild focal cooling (left). An exemplar layer 5 pyramidal neuron loaded with Alexa 488 (100 μM) (scale bars, 50 μm). (Inset) Dendritic segments that underwent the plasticity protocol without (top, red) and under the influence of focal cooling (bottom, blue) (scale bars, 5 μm).
B) Field-evoked EPSP amplitude as a function of low-frequency plasticity induction in the presence and absence of mild focal temperature modulation (data not shown for the case without cooling). The initial readout at 1 Hz (gray) is followed by potentiation at 0.1 Hz and subsequent readout again at 1 Hz (blue). While the initial (grey) and final readouts (blue) are performed at 35°C, the plasticity induction is carried out at two different temperatures for comparison − 35°C (data not shown) and 30°C (grey). For clarity, the initial and final readouts at 1Hz and the potentiation (0.1 Hz) are only shown for the case in which plasticity was induced at 30°C. Note the induced plasticity is amplified under the influence of mild focal cooling.
C) Comparison between the percentage of increase (post vs. control) in the field-evoked EPSP amplitude while low-frequency potentiation is performed at different temperatures (protocol as described in B). (Wilcoxon Mann Whitney test, n=7 neurons, p=0.0346). Error bars represent the standard error of the mean (SEM).
D) (i) Uncaging-evoked responses from spines located on tuft dendritic branches plasticized using the plasticity protocol without the effect of cooling (top, red) and under the influence of cooling (bottom, blue) (scale bars, 20 μm). (Inset) Dendritic segments on which spines were uncaged before and after plasticity induction without (top, red) and under the influence of focal cooling (bottom, blue) (scale bars, 5 μm). (ii) Uncaging-evoked responses across spines located on target dendrites (left), depicting the difference between baseline (gray) and post-LTP induction (red: 35°C; blue: 30°C; signifies the temperatures at which plasticity was carried out), and percentage of increase (post-LTP vs. baseline control) for uncaging-evoked response (right) (Wilcoxon Mann Whitney test, n=7 neurons, p=0.0262). Error bars represent the standard error of the mean (SEM).
E) Schematic of the experimental protocol for probing the temperature dependence of branch-specific potentiation via a readout of nonlinear input-output transformations across the tuft dendrite. Low-frequency field stimulation evokes plasticity, while two-photon glutamate uncaging probes nonlinear input-output characteristics before (control, grey) and after (post, either red or blue) plasticity induction. Arrows indicate an increasing number of spines stimulated. Focal cooling is only applied during the induction phase, while control and post-induction readout occur at 35°C.
F) (i) Normalized dendritic input-output response measured at the soma before and after plasticity induction at 35°C (Wilcoxon signed rank test, n=7 neurons, *p<0.05). (ii) Similar to (i), but here plasticity induction was performed alongside moderate cooling (Wilcoxon signed rank test, n=7 neurons, *p<0.05). (iii) Comparison showing the percentage of amplitude increase for plasticity induced with focal cooling and without focal cooling (Wilcoxon Mann Whitney test, n=7 neurons, *p<0.05). Error bars represent the standard error of the mean (SEM).

