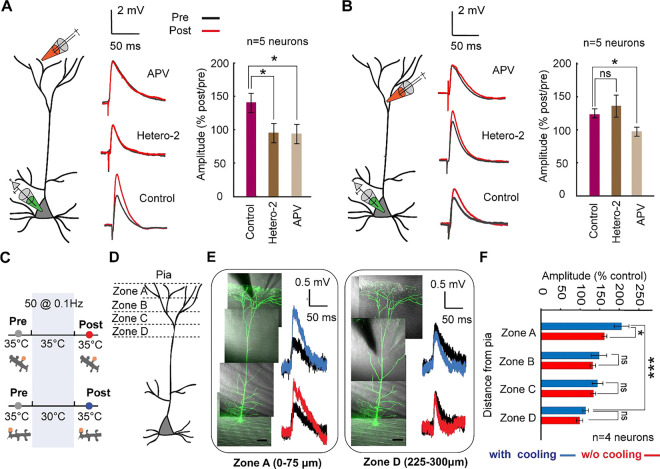
Fig. 3. Gradient of plasticity along the apical dendrite.
A) Experimental configuration. Field stimulation is used to evoke plasticity in the distal tuft dendrite (within 50 μm from pia) under the low frequency protocol. Example field-evoked EPSPs for pre (black) and post (red) stimulation for the control condition (bottom), after adding Heteropodatoxin-2 (Hetero-2, middle), and after adding APV (top). (Right) Comparison showing the percentage of EPSP increase (post vs. pre) with and without application of pharmacological blockers (Wilcoxon Mann Whitney test, n=5 neurons in each condition, Hetero-2 vs. control p=0.046 and APV vs. control: p=0.0159). Error bars represent the standard error of the mean (SEM).
B) Similar experiment to that shown in (A) but performed in zone C at a different location of the tuft dendrite (within 200 μm from pia) (Wilcoxon Mann Whitney test, n= 5 neurons, Heter-2 vs. control: p= 0.9307, and APV vs. control: p=0.0159). Note the difference in both potassium channel dependence and amplification in plasticity in comparison to the distal tuft in (A). Error bars represent the standard error of the mean (SEM).
C) Schematic of the experimental protocol for probing the gradient of the temperature dependence of low frequency induced plasticity along the tuft dendrite. Low-frequency field stimulation evokes plasticity, while two-photon glutamate uncaging is used to record the EPSP amplitude of control (grey) and after (post, either red or blue) plasticity induction. Focal cooling is only applied during the induction phase, while control and post-induction readout occur at 35°C.
D) Schematic depicting different distal tuft dendritic zones (zone A: 0–75 μm from pia, zone B: 75–150 μm from pia, zone C: 150–225 μm from pia, zone D:225–300 μm from pia).
E) Exemplar layer 5 pyramidal neurons (scale bars, 50 μm) shown for two different dendritic zones (zone A and zone D) that underwent field-evoked low-frequency plasticity. (Right) uncaging-evoked EPSPs depicting the difference between baseline (black) and post-LTP induction (red: 35°C; blue: 30°C; signifies the temperatures at which plasticity was carried out).
F) Summary plot of the percentage of change in EPSP amplitude after LTP induction across different locations along the apical dendrite with and without mild focal cooling (Wilcoxon Mann Whitney test, n=6 dendrites from 4 neurons, *p<0.05, ***p<0.001). Error bars represent the standard error of the mean (SEM).

