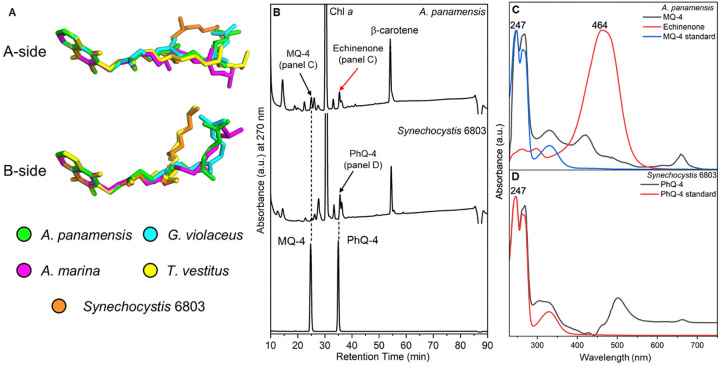
Fig. 3. The structure and HPLC analysis of MQ-4 and PhQ-4 in the PSI.
(A) Structures of quinones from selected PSI structures. C atoms in the quinone rings of the quinones in PSI structures from A. panamensis, G. violaceus, A. marina, T. vestitus, and Synechocystis 6803 are superimposed. The latter four correspond to PDBs 7F4V, 7COY, 1JB0, and 5OY0, respectively. (B) HPLC elution profile of extracts from PSI complexes of A. panamensis and Synechocystis 6803 (top two traces, respectively), and a standard containing MQ-4 and PhQ-4 (bottom trace). The black arrow indicates the peak of quinones in the PSI extracts. The red arrow indicates the peak of echinenone in the A. panamensis PSI extract. (C) Absorption spectrum of MQ-4 standard, MQ-4 and echinenone from PSI of A. panamensis. (D) Absorption spectrum of PhQ-4 standard and PhQ-4 from PSI of Synechocystis 6803.

