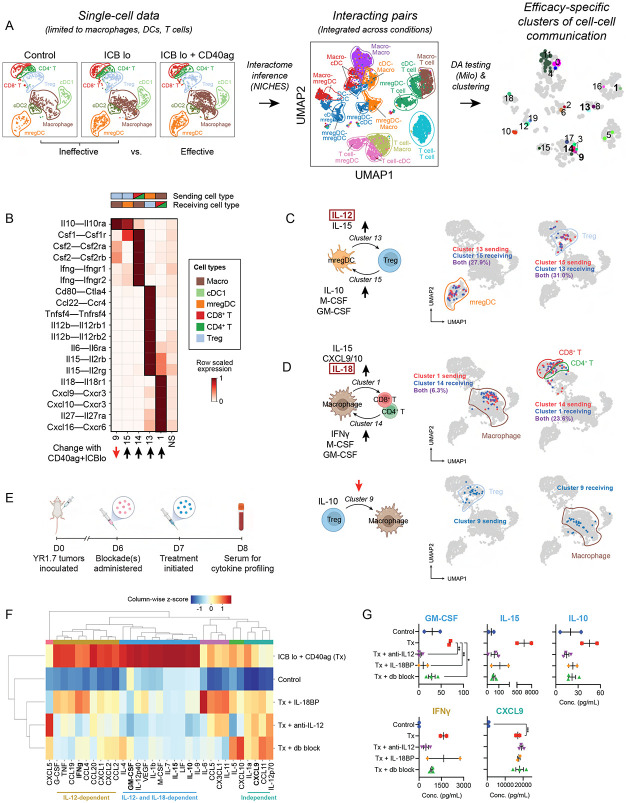
Figure 5. Single-cell resolved cell-cell interaction analysis shows that CD40ag combines with ICB to activate a coordinated cytokine-chemokine network between DCs, macrophages, and T cells.
(A) UMAP embeddings of macrophages, DC subsets, and T cell subsets in gene expression space (left); and of corresponding NICHES interactomes (center) colored by broad cell type pair and (right) grouped into nhoods for differential abundance testing and colored by cluster for downstream analyses. Interactomes across experimental conditions (Control, ICB lo, ICB lo + CD40ag) are combined into a single visualization.
(B) Heatmap depicting per-row scaled interaction scores for selected differentially predicted ligand-receptor axes (y-axis) across clusters 9, 15, 14, 13, 16, and 1 and compared to all non-differentially abundant neighborhoods (i.e., NS) (x-axis). The key above the heatmap distinguishes which cell type sender-receiver pairs are involved in each highlighted cluster.
(C-D) UMAP embeddings as in (A, left) colored by (C) mregDCs (left) and Tregs (right) predicted to interact in clusters 13 and 15, (D, top) macrophages (left) and T cells (right) predicted to interact in clusters 1 and 14, and by (D, bottom) Tregs (left) and macrophages (right) predicted to interact in cluster 9.
(E) Schematic illustrating the timeline of serum collection for peripheral blood cytokine and chemokine (C/C) profiling from ICB lo + CD40ag-treated YR1.7 tumor-bearing WT C57Bl/6J mice which had been previously treated with IL-12 and/or IL-18 blockade. Created with BioRender.com.
(F) Hierarchical clustering of average C/C data from YR1.7 tumor-bearing mice either left untreated (n=3), or treated with ICB lo + CD40ag (n=2, abbreviated Tx in figure), Tx + IL18BP-Fc (n=2), Tx + anti-IL12 Ab (n=3), or Tx + anti-IL12 Ab + IL18BP-Fc (n=3). C/Cs were grouped into 6 modules for downstream analyses.
(G) Example plots of peripheral blood cytokine expression levels for GM-CSF, IL-15, IL-10, IFNg, and CXCL9, from samples shown in (F). Summary data is presented as mean ± SEM. *p < 0.05, **p < 0.01 by ordinary one-way ANOVA with Dunnett’s multiple comparisons testing (calculated in GraphPad). Only showing significant results for comparisons between Tx and other conditions.

