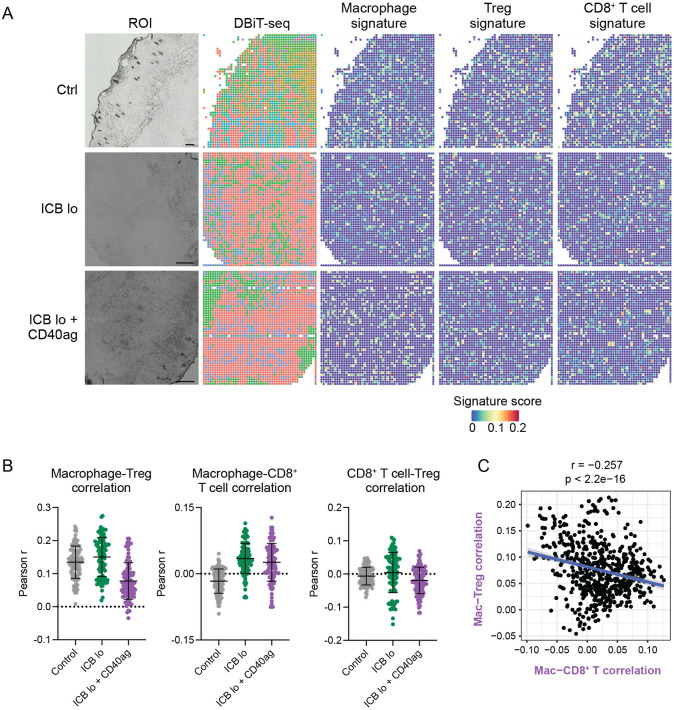
Figure 6. ICB and CD40ag acutely and differentially alter immune spatial orientation and inflammatory signaling.
(A) DBiT-seq spatial transcriptomics analysis of YR1.7 tumors harvested from mice 24 hours post-treatment where applicable. Left: Region of interest (ROI). Middle: DBiT-seq spots. Right: macrophage, Treg, and CD8+ T cell signature scores for each pixel in the spatial transcriptomics spot map demonstrating the presence of each cell type in the TME. Scale bars are 200 μm.
(B) Scatter plots demonstrating per-pixel Pearson correlation coefficients between (left) macrophage and Treg signature scores, (middle) macrophage and CD8+ T cell signature scores, and (right) CD8 + T cell and Treg signature scores for 100 20x20 grids randomly sampled from each DBiT-seq sample (control – grey, ICB lo – green, ICB lo + CD40ag – purple). Summary data is presented as mean ± SD.
(C) Scatter plot comparing correlation between macrophage and CD8+ T cell signature scores (x-axis) to correlation between macrophage and Treg signature scores (y-axis) for corresponding 1000 20x20 grids randomly sampled from the ICB lo + CD40ag-treated DBiT-seq sample.

