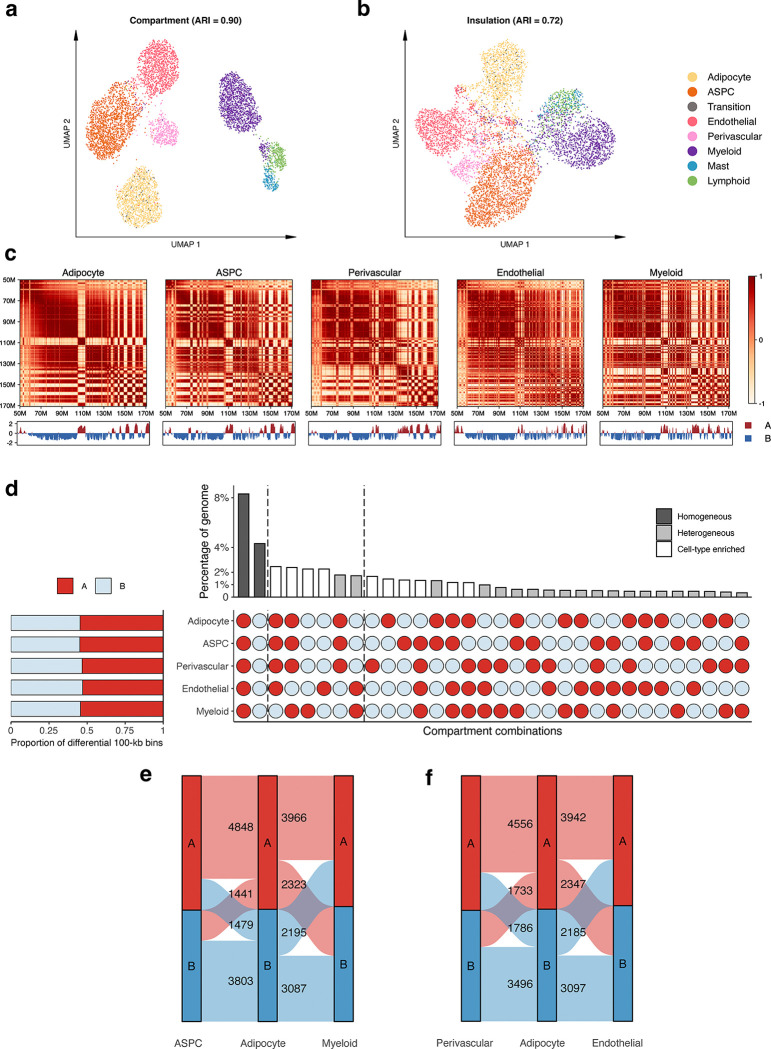
Extended Data Figure 5. Cell-type level differences in chromatin conformation of subcutaneous adipose tissue (SAT).
a-b, Uniform manifold approximation and projection (UMAP) visualization of low dimensional embeddings of cells using compartment (a) and insulation scores (d) as features, colored by the snm3C-seq annotation. Adjusted rand index (ARI) evaluates the clustering concordance against snm3C-seq annotation. c, Heatmap visualization of the normalized interaction contact map on chromosome 6 and its corresponding compartment scores across the SAT cell-types. d, Horizontal stacked bar plot (left) showing the marginal proportions of differential 100-kb bins stratified by their annotated A and B compartments in the 5 most abundant SAT cell-types and upset plot (right) showing all compartment combinations across differential 100-kb bins in decreasing order with their corresponding percentages (Homogeneous, Cell-type enriched, and Heterogeneous correspond to unique A or B compartment in 0, 1, or more than 1 cell-types, respectively). e, Sankey diagram breaking down of the numbers of differential 100-kb bins annotated as A (red) and B (blue) compartment belonging to ASPCs (left), adipocytes (middle), and myeloid cells (right). f, Similar to e, except on perivascular cells (left), adipocytes (middle), and endothelial cells (right). ASPC indicates adipose stem and progenitor cells.

